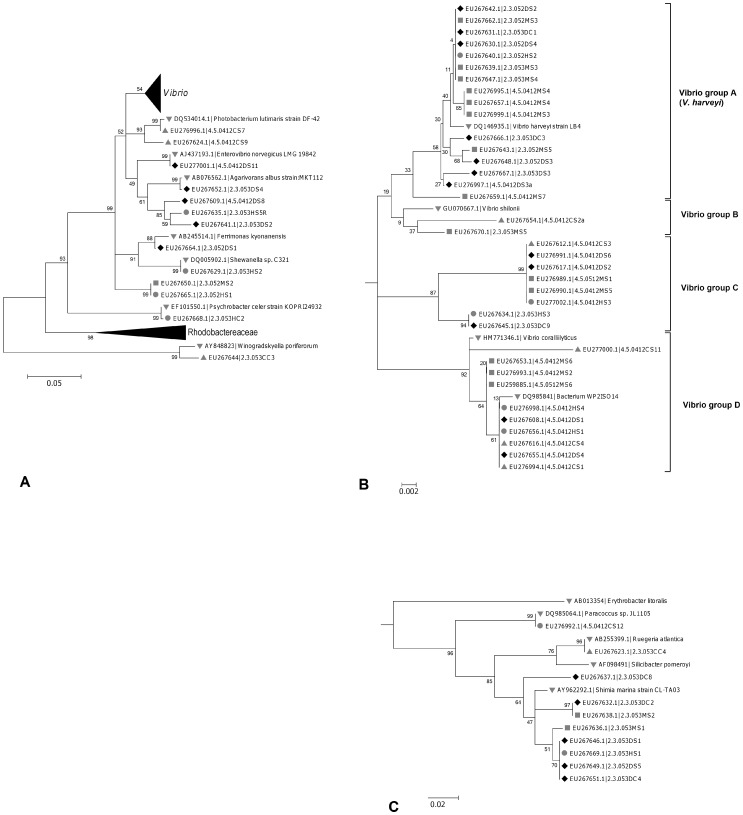
Figure 5. Phylogenetic tree showing the taxonomic relationships of culturable bacterial isolates.
A. All isolates. B. Vibrio spp. subtree C. Rhodobactereacea subtree. Phylogeny was inferred using the maximum likelihood method based on the Tamura-Nei model [66]. The tree displayed is the bootstrap consensus tree inferred from 500 replicates. Branches corresponding to partitions reproduced in less than 50% bootstrap replicates are collapsed. The percentage of replicate trees in which the associated taxa clustered together in the bootstrap test (500 replicates) are shown next to the branches. The level of bootstrap support near the ends of some branches is low because these branches included several isolates with very high levels of sequence identity. All positions containing gaps and missing data were eliminated, leaving a total of 466 positions in the final dataset. Phylogenetic analyses were conducted in MEGA4 [34]. The evolutionary distances were computed using the Maximum Composite Likelihood method. The trees are drawn to scale, with the scale bars indicating the number of substitutions per nucleotide position. Clusters of organisms at branch ends share >99.5% sequence similarity, and are treated as the same organism for the purposes of this discussion. Markers on the left indicate the sample categories that each organism in the tree was isolated from (♦ exposed dead skeleton adjacent to living tissue of ASWS affected colonies (D), ▪ the interface between exposed skeleton and apparently healthy tissue at the margin of disease lesions (M), • the apparently healthy tissue adjacent to disease lesions on ASWS affected colonies (H), ▴ Apparently healthy colonies(C), ▾ related sequences retrieved from public databases).

