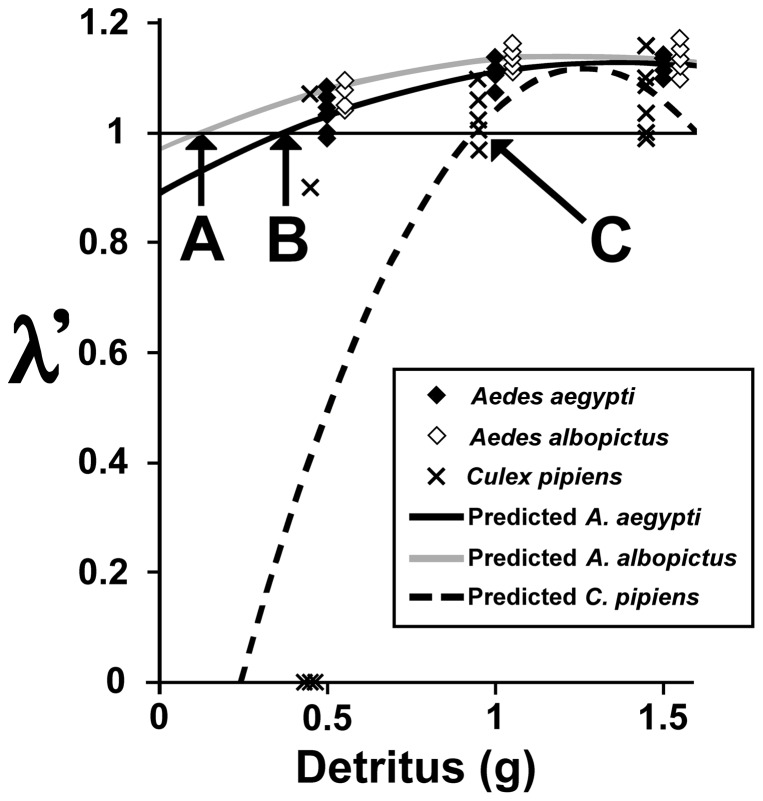
Figure 2. Experimental response of mean λ′ for each species by detritus amounts.
Data points for A. albopictus and C. pipiens are offset. The curves represent the quadratic function for each species, while the arrows indicate values of x at which λ′ = 1.0 (RIndex) for A. albopictus (A), A. aegypti (B), and C. pipiens (C).

