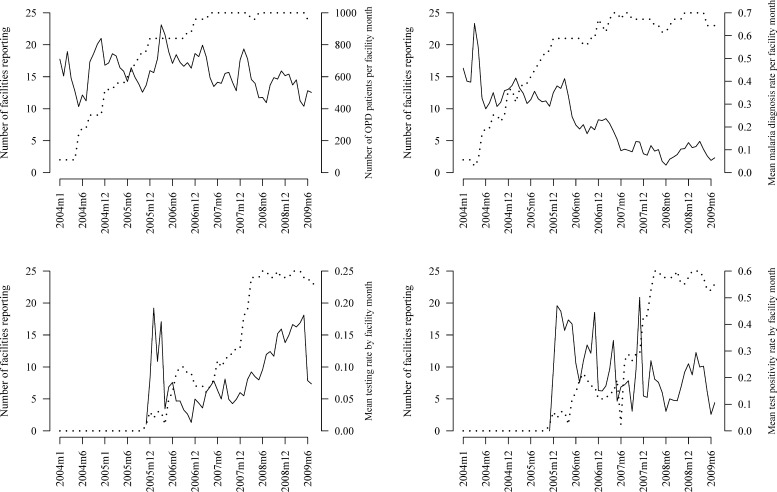
Figure 2.
Trends in outpatient visits, malaria diagnosis, testing rate, test positivity rate and reporting completeness at study clinics. (Average value of the indicator across reporting facilities is shown as a solid line; the number of facilities reporting is shown with dotted line referring to left vertical axis in all figures.)

