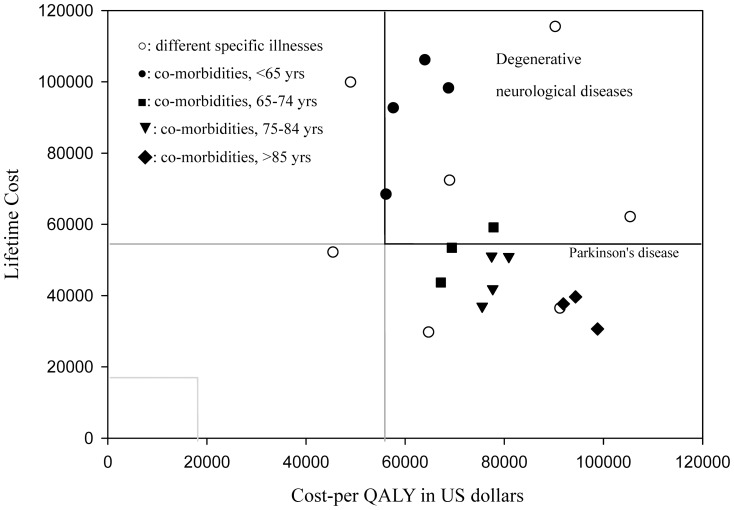
Figure 4. Plot of association between the cost-per-QALY (quality-adjusted life year) gained and the lifetime cost for different diagnosis groups of PMV patients with partial cognition.
, stratified by different specific illnesses [○] and multiple co-morbidities (indicated by sub-age groups, <65[•], 65–74[▪], 75–84[▾], and >84[□] years old). The GDP (gross domestic product) of Taiwan in 2010 was 18,588 US dollars, below which the cost-per-QALY was considered as cost-effective; between 1–3 times the GDP per QALY gained was considered moderate cost-effective, and above 3 times the GDP per QALY gained was not cost-effective. The figure indicates there are many conditions showing a lifetime cost less than 3 times the GDP, although their costs-per-QALY were above that figure.

