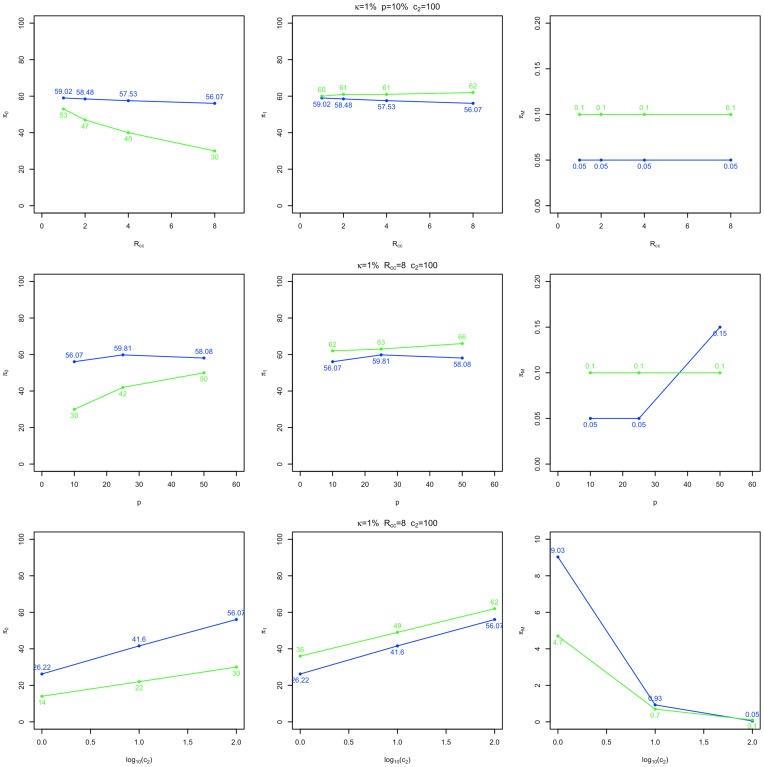
Figure 3. Design parameter curves for minimum cost designs.
Two stage minimum cost, 78% power GWAS design parameters calculated by CaTS (blue) and the unrestricted methods described here (green) are provided for three experimental conditions:  as a function of
  ;
;  as a function of
  ; and
; and  as a function of
  (where
  is disease prevalence,
  the population disease allele frequency,
  the stage 2 genotyping cost and
  the ratio of controls to cases). Each case is assigned a row, and design parameter plots for
  ,
,  and
and  (the proportion of controls and cases assigned to stage 1, and the proportion of markers expected to be passed to stage 2) are displayed from left to right. Compared to designs computed by CaTS, designs computed without a
  constraint typically assign lower and higher proportions of controls and cases (respectively) to stage 1, and pass a greater proportion of markers to stage 2. The degree of difference in design specification between the two methods can be substantially influenced by each of
  ,
,  and
and  .
.

