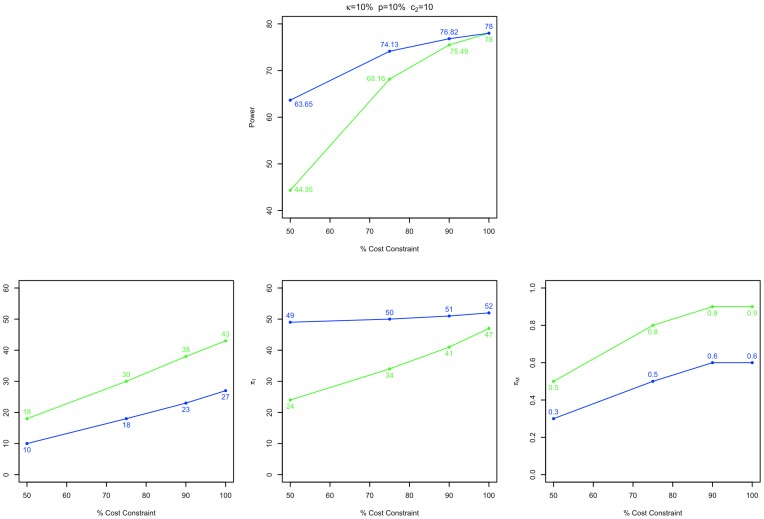
Figure 5. Performance and design characteristics of maximum power GWAS designs.
The maximum achievable power and related experimental design parameters for the experimental condition  are plotted for control/case ratios
  in blue and green respectively, as a function of percentage cost of a minimum cost, 78% power design. Although increasing the degree of cost constraint does have a negative effect on the achievable power of a 2S-GWAS, recomputing a power maximizing design can help to mitigate this. In comparison to the original cost minimized design, power maximizing cost limited designs typically pass a lower proportion of markers to stage 2, and then increase the relative power of the stage 2 test by allocating a greater proportion of both cases and controls to it.

