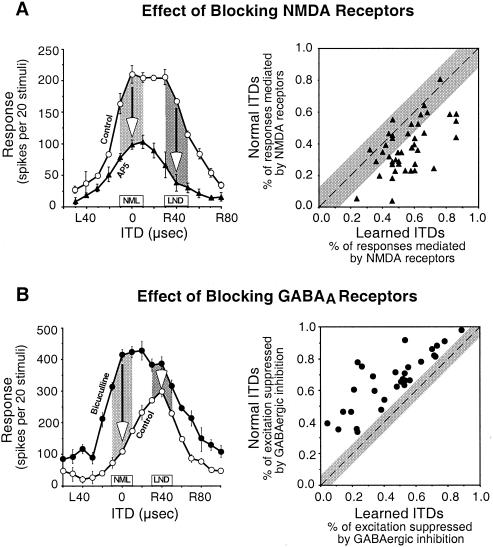
Figure 5.
Pharmacological traces of learning in the ICX of the barn owl. (A) Newly learned responses are differentially mediated by NMDA receptors. (Left) Effect of iontophoretic application of AP5, a specific antagonist for NMDA receptors, on the ITD tuning of an ICX site that was at an early stage of learning. Arrows indicate the AP5-induced decrease in responses to the normal (NML) and learned (LND) ITDs, respectively; learned ITDs were 40 μs away toward right-ear leading from normal ITDs. (Right) Comparison of the proportion of the responses mediated by NMDA receptors, calculated as (control response − response with AP5)/control response, between normal and learned ITDs for all ICX sites (n = 41) that were at an early stage of learning. The diagonal dashed line denotes equal percentage of NMDA-receptor-mediated responses to normal and learned ITDs. The gray region represents the mean ± 2 SD of the difference in the percentage of NMDA-receptor-mediated responses to ITDs ± 40 μs away from the best ITD on each side of ITD tuning curves in normal owls. Data are from Feldman and Knudsen (34). (B) Normal responses are selectively suppressed by GABAergic inhibition. (Left) Effect of iontophoretic application of bicuculline, a specific antagonist for GABAA receptors, on the ITD tuning of an ICX site that was at a late stage of learning. Arrows indicate the amount of excitation that was suppressed by GABAergic inhibition at the normal (NML) and learned (LND) ITDs, respectively. (Right) Comparison of the percentage of excitation that was suppressed by GABAergic inhibition, calculated as (response with bicuculline − control response)/response with bicuculline, between normal and learned ITDs for all ICX sites (n = 30) that were at a late stage of learning. The diagonal dashed line denotes an equal percentage of GABAergic suppression for the normal and learned ITDs. The gray region represents the mean ± 2 SD of the difference in percentage of GABAergic suppression of excitation for ITDs ± 40 μs away from the best ITD on each side of ITD tuning curves in normal owls. Data are from Zheng and Knudsen (35).

