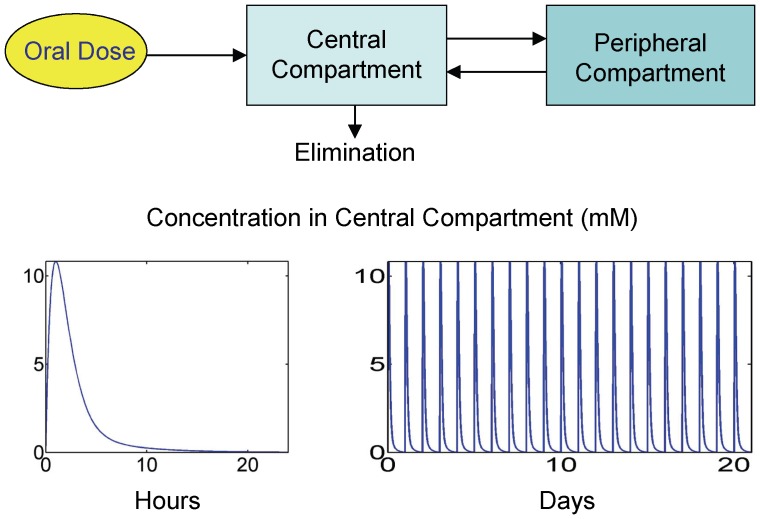
Figure 3. Finasteride pharmacokinetic (PK) model as reported in Stuart, et al. (2001) [26].
A 2-compartment model was described (top figure) with linear absorption and elimination terms. The equation for the central compartment was modified in FM to account for finasteride binding to prostatic 5aR2 (see the differential equation list for FM in Text S3). The bottom-left plot depicts a single, 40 mg/kg dose, PK profile over 24 hours. The bottom-right plot depicts daily 40 mg/kg dosing for 21 days, corresponding to the experimental conditions described in [42]. Plots depict total plasma finasteride concentrations.

