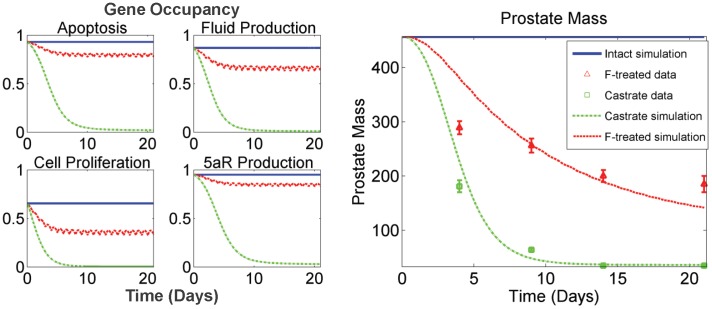
Figure 5. Downstream effects of prostatic hormone kinetics.
(Left panel) Model simulations of time courses for gene occupancies (as fractions of complete occupancy) for anti-apoptosis, fluid production, cell proliferation, and enzyme (5aR2) production. Note the substantially larger effect castration is predicted to have on the anti-apoptosis and enzyme production genes. (Right panel) Model fits to prostate mass data (mg) described in [42] under three experimental conditions: intact, castrated and finasteride (F)-treated (daily dosing for 21 days at 40 mg/kg). Intact prostate mass is 457 mg (average, based on Rittmaster data), depicted at the very top of the plot. When DHT is nearly depleted from F dosing (see Figure 4), elevated T levels are not capable of maintaining intact prostate mass (right panel).

