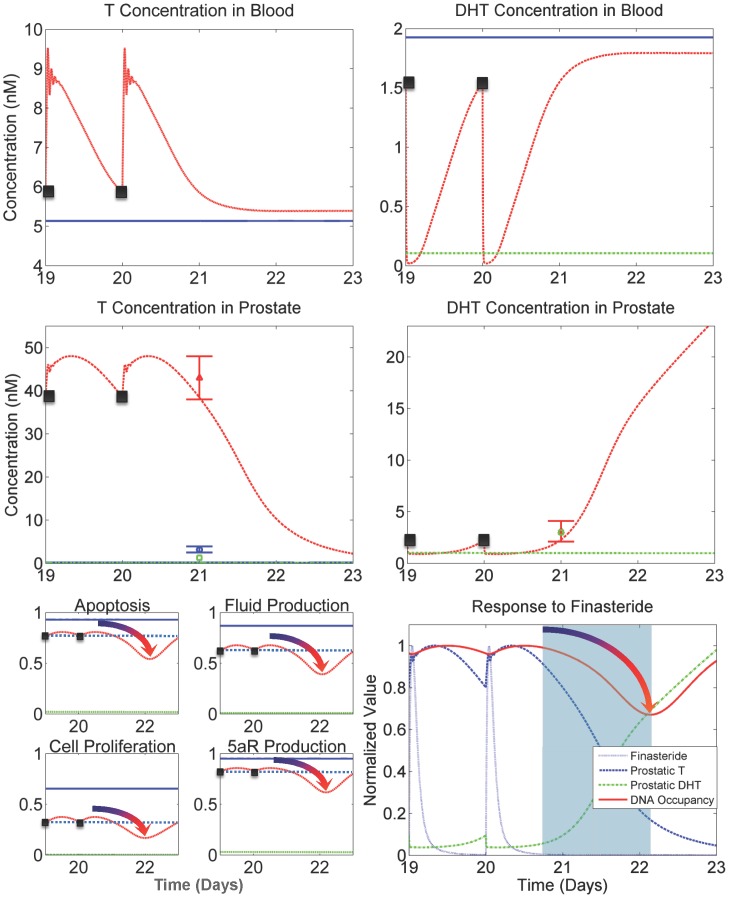
Figure 6. Kinetics of T and DHT and their predicted effects on prostatic gene occupancy.
Black points in the plots represent the 20th and 21st (last) finasteride dose in the simulation. The plots extend three days in time after the last dose to capture rebound effects. (Top right panel) Blood DHT drops quickly in response to plasma finasteride exposure, mainly due to liver 5aR1 inhibition. (Top left panel) Blood T responds quickly to decreasing blood DHT concentrations via LH signaling in the testicular-pituitary axis. (Middle right panel) Prostatic DHT concentrations are decreased due to dropping levels of blood DHT and prostatic 5aR2 inhibition. (Middle-left panel) Prostatic T concentrations increase due to rising blood T levels and decreased 5aR2 activity. (Bottom left panel) Gene occupancies demonstrate the significant influence of T and DHT kinetics on downstream events. Note that gene occupancies increase between doses 20 and 21 (black dotted line depicts gene occupancy level at time of dose), yet after the increase from the last dose the occupancy significantly decreases before finally increasing to return to baseline (intact value). This behavior is shown in the plots by the gradient-shaded arrows. (Bottom-right panel) The kinetics of finasteride, prostatic T and DHT, and gene occupancy (anti-apoptosis depicted) are shown simultaneously in a single time course (values were normalized for scaling purposes). The kinetics of gene occupancy are directly tied to the combination of kinetics between T and DHT. The rise in occupancy between doses is caused by the rise in prostatic T. The light blue shaded region shows where T and DHT are collectively at their lowest point in the time course. This is followed by the observed decrease in gene occupancy, which takes place well after the drug has significantly cleared.

