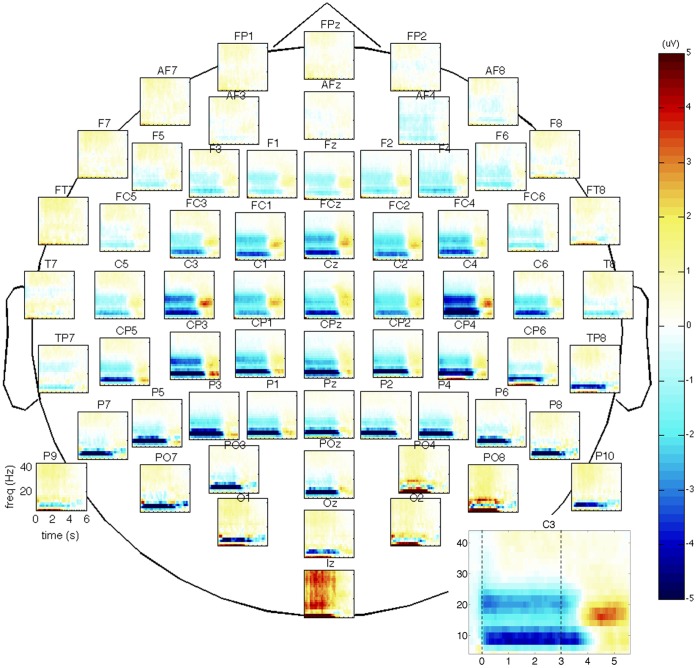
Figure 3. Grand average time-frequency plot of all 64 channels.
Spatial downsampling was performed with a Surface Laplacian; the period from t = −1.5 to t = −0.5 s was used as the baseline period. Blue colouring represents ERD; red represents ERS. The motor cortex is situated in the central regions (C3–C4). An enlargement of channel C3 is shown in the right-hand corner, with the dashed lines indicating the onset and offset of the auditory cue (task period).

