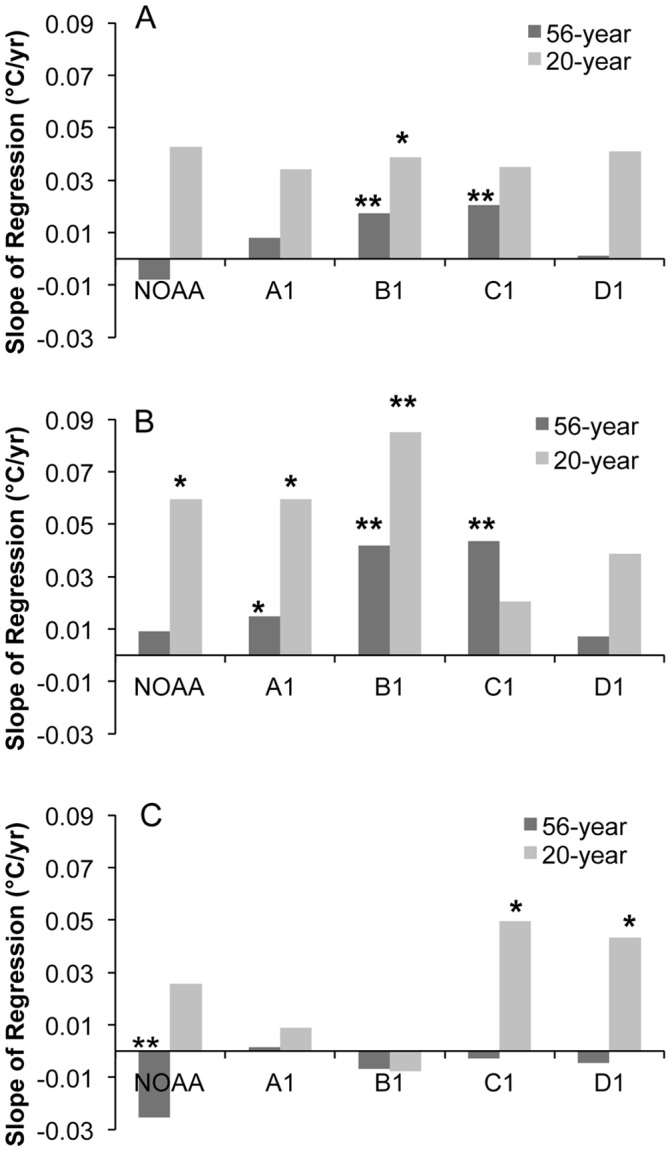
Figure 2. Yearly temperature trends derived by linear regressions for the periods of 1953–2008 (56-year) and 1989–2008 (20-year) across the RMFR transect.

Trends shown as changes in the average yearly (A) mean, (B) maximum and (C) minimum temperatures (°C) per year. Significance level of regressions denoted by * p<0.05, ** p<0.01.
