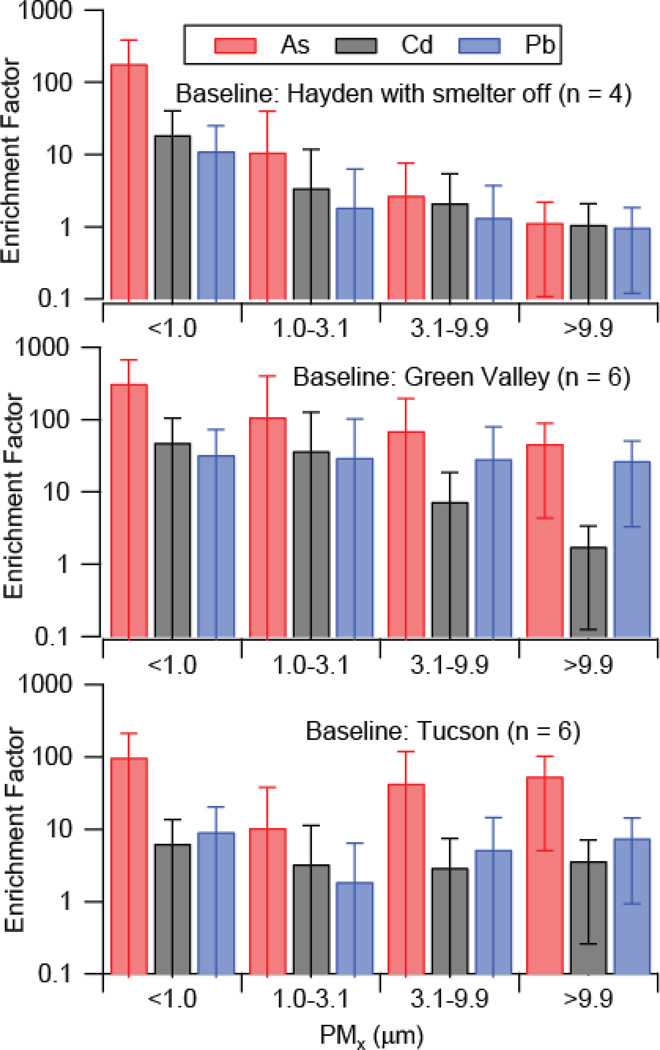
Figure 4.
Size-resolved enrichment factors (Eq. 1) of aerosols sampled adjacent to an active copper smelter and mine tailings. Error bars represent standard deviations. Three baseline locations are shown for comparison including the same site when the smelter was shut down, Green Valley, and Tucson (sites shown in Figure 1). The analysis is based on 59 MOUDI sample sets collected at the measurement site when the smelter was active. The data shown in this figure are from between December 2008 and April 2011. Specific sample collection dates are available in the Supporting Information.

