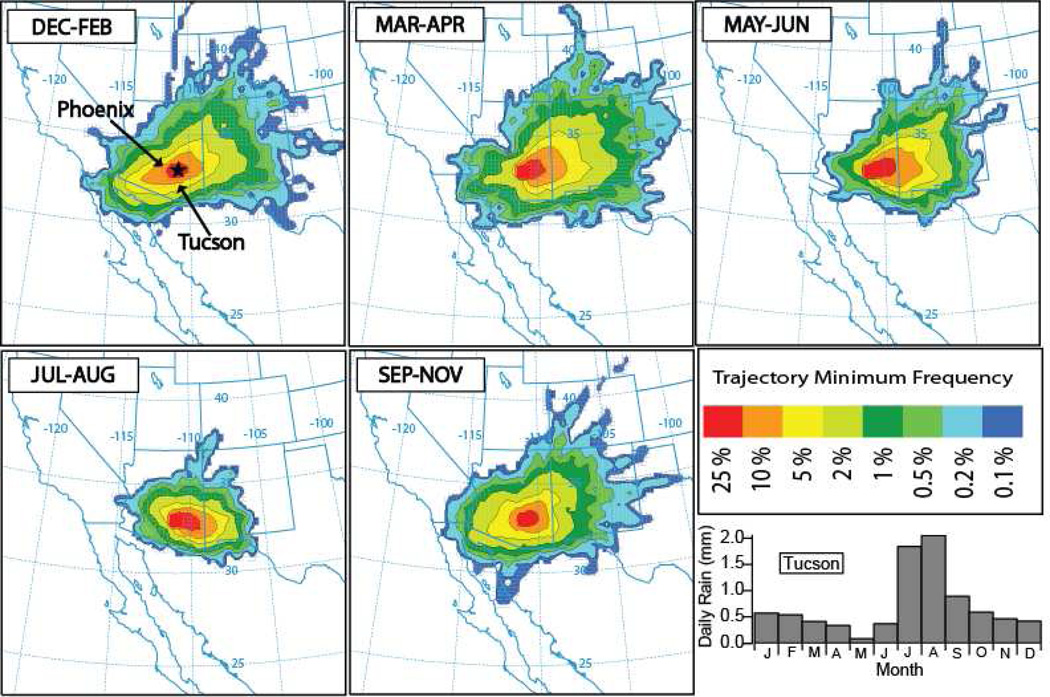
Figure 5.
Average forward trajectory frequency plots as a function of time of year using daily data between 2005–2010 from the HYSPLIT model. (The model simulated the release of air parcels from above the surface of the mine tailings near the towns of Hayden and Winkelman, denoted by the star label in top left panel, and tracked for 24 h.) Colors indicate the minimum frequency of air parcels at a given point when originating from the source point. Locations of the two metropolitan centers of Tucson and Phoenix are shown in the top left panel. The bottom right panel shows the annual profile of daily precipitation accumulation (average of daily data for each month, including days with no rainfall) averaged over 2000–2009 at a representative location near the source point (Tucson), which independently suggests that wet scavenging of aerosols limits the transport range of particulate matter between July and August as compared to other months.

