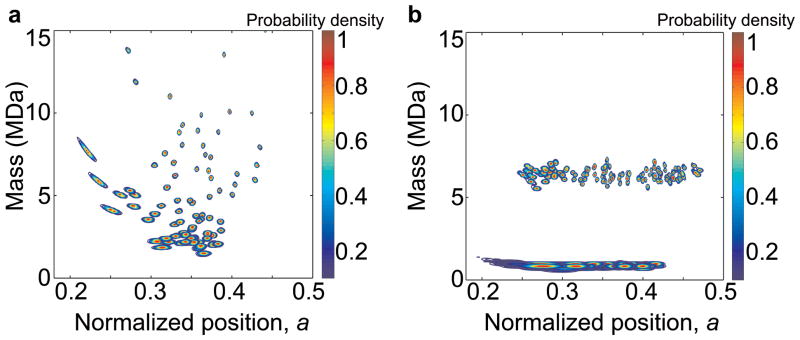
Figure 3. Joint probability distributions for analyte mass and position-of-adsorption.
a, Experimental data of 5nm gold nanoparticles from the MALDI experiment. Each analyte captured by the NEMS resonator has an error disk that reveals its uncertainty in its mass and position-of-adsorption on the NEMS resonator. b, Monte-Carlo simulations of 5 and 10nm gold nanoparticles assuming a much lower size variance (~2%, no clustering) than the actual samples (~15–20%, with clustering). These simulations reveal the respective mass “bands” that would be expected for nearly monodisperse gold nanoparticle distributions.

