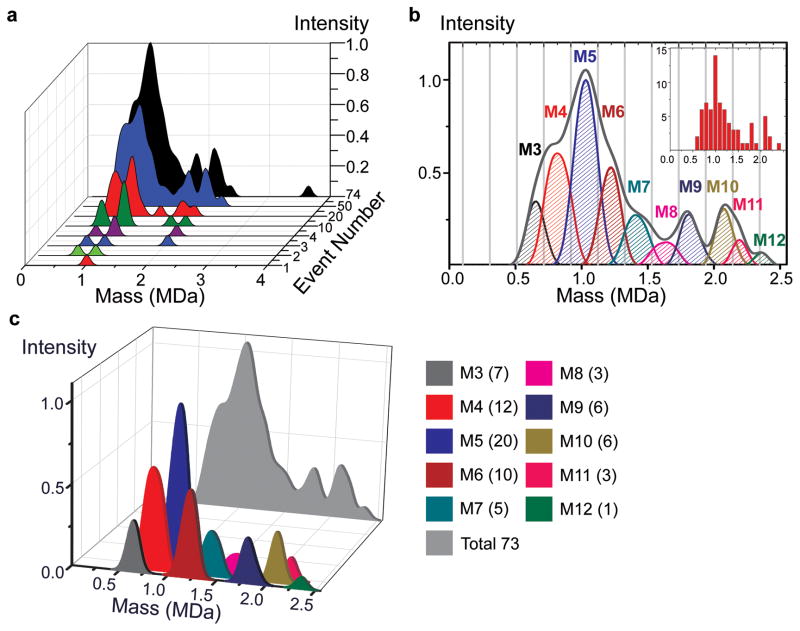
Figure 5. The nanomechanical mass spectra for Human IgM.
a, Molecule-by-molecule acquisition of the mass spectra for human IgM. Analytes accumulating at different molecular weights correspond to different isoforms of the molecule. The final spectrum shown in black is the additive result of individual mass measurements on 74 accreted molecules and has readily identifiable sharp peaks corresponding to major isoforms of IgM typically found in human serum.
b, Decomposition of the IgM spectra into different polymerization levels. Gray lines delineate the cut-off thresholds used in assigning the different forms of IgM. The most dominant form of IgM in the human serum is the pentameric form (M5) with a molecular weight of approximately 1 MDa, observed as the global maximum of the NEMS MS spectra. Subpopulations of other forms are also observed, at masses corresponding to M3, M4, and M6 through M12. Inset shows the histogram of the event masses binned according to mass resolution. The vertical axis of the inset corresponds to the number of events, while the horizontal axis is the mass in MDa.
c, Mass spectra of individual subunits are displayed quantitatively with single-molecule accuracy. Intensity peaks of different polymerized forms of IgM (M3 to M12) yield the mathematically integrated composite mass spectrum (light grey) of the IgM sample. The numbers in parenthesis in the legend show the number of measured molecules for each isoform.

