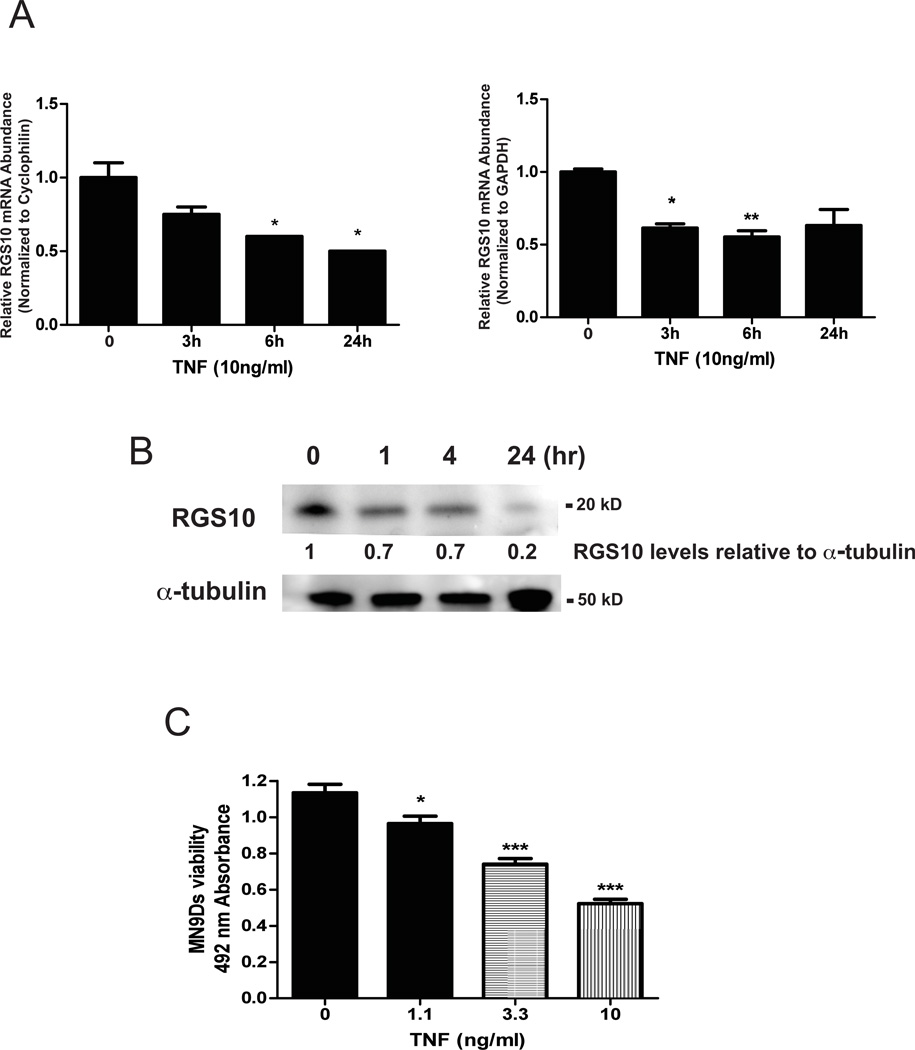
Figure 1. TNF-induced down-regulation of RGS10 mRNA and protein in dopaminergic (DA) cells correlates with TNF-induced cytotoxicity.
MN9D cells were plated and neurally differentiated as described under Methods. Cells were treated with 10 ng/mL of TNF for the times indicated. A, Levels of RGS10 mRNA were measured by real-time quantitative PCR and normalized to one of two housekeeping genes GAPDH or cyclophilin. Values represent mean ± SEM. QPCR analysis was performed by one-way ANOVA followed by Tukey’s post hoc test, * denotes p < 0.05 and ** denotes p < 0.01 relative to the untreated sample. B, Levels of RGS10 protein were measured by western blot analysis. Bands immunoreactive for RGS10 were quantified by densitometry and normalized to α-tubulin as a protein loading control. Blots are representative of three independent experiments. C, MN9D cell viability was assessed using the MTS assay as described under Methods. Values represent mean ± SEM. One way ANOVA followed by Tukey’s post hoc test, * denotes p < 0.05 and *** denote p < 0.001 relative to the untreated sample.

