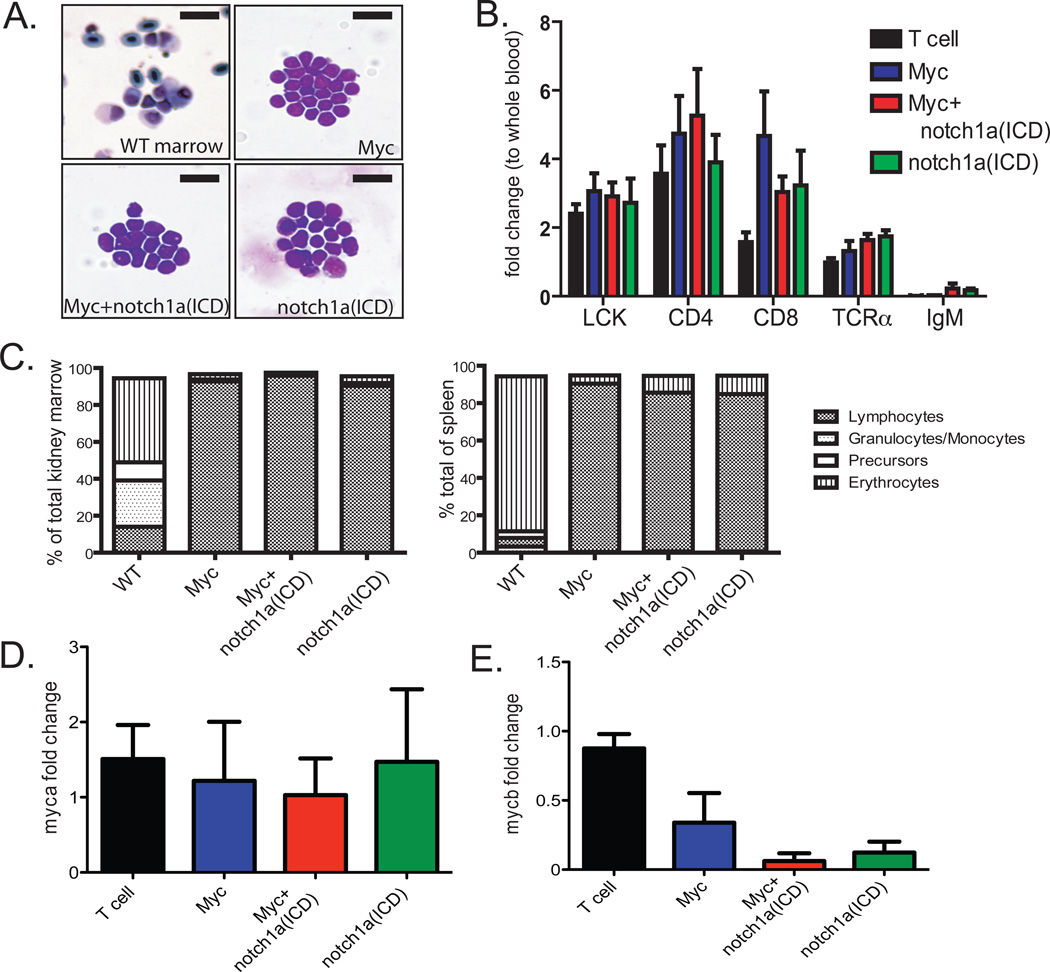
Figure 2. Characterization of mosaic transgenic zebrafish with Myc-, Notch- and Myc+Notch-induced T-ALL.
(A) May-Grünwald and Wright-Giemsa stained cytospins of kidney marrow from wild-type and mosaic transgenic zebrafish from each genotype. Scale bar, 20 µm. (B) Real-time RT-PCR analysis of the T cell-specific genes lck, CD4, CD8 and TCRα, and the B-cell gene IgM in normal rag2-GFP thymocytes, and GFP-positive T-ALL cells from mosaic transgenic animals. Data are the average expression from 4 primary T-ALL per group. Samples were normalized to ef1α expression and gene expression is shown relative to whole blood cells isolated from normal CG1-strain fish. Error bars are the standard deviation (SD). (C) Representative FACS analysis of kidney marrow (left) and spleen (right) from wild-type and mosaic transgenic zebrafish that developed T-ALL. The percentage of lymphocytes, granulocytes/monocytes, hematopoietic precursors and erythrocytes were quantified by analysis of cell size and granularity. (D) Real-time RT-PCR analysis of zebrafish myca and (E) mycb expression in normal thymocytes and T-ALL cells. Data are the average of 6 individual primary T-ALL, normalized to ef1α expression and relative to rag2-GFP thymocytes isolated from 45d animals. Errors bars are +/− SD.

