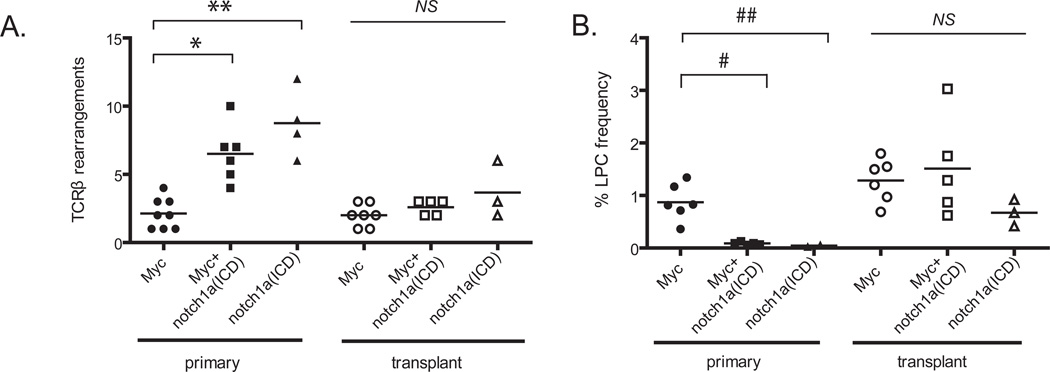
Figure 5. Notch expands a pool of pre-malignant clones but does not enhance the frequency of LPCs within the leukemia.
(A) A PCR based assay to detect TCRβ rearrangements was used to determine the number of T-cell clones that comprise the primary and transplanted T-ALL. *p<0.0001, comparing primary Myc- and Myc+notch1a(ICD)-induced T-ALL,**p<0.0001, comparing Myc and notch1a(ICD)-expressing T-ALL, NS not significant, comparing transplanted T-ALL. (B) Extreme Limiting Dilution Analysis (ELDA) statistical software was used to calculate the LPC frequency within Myc-, notch1a(ICD)- and Myc+notch1a(ICD)-induced primary and transplanted T-ALL. Each point represents the average LPC frequency of one T-ALL. The raw data are presented in Table 1 (n=1,059 transplant animals). #p<0.0001, comparing primary Myc and Myc+notch1a(ICD)-induced T-ALL, ##p<0.0001, comparing Myc and Myc+notch1a(ICD)-induced T-ALL, NS not significant, comparing transplanted T-ALL.

