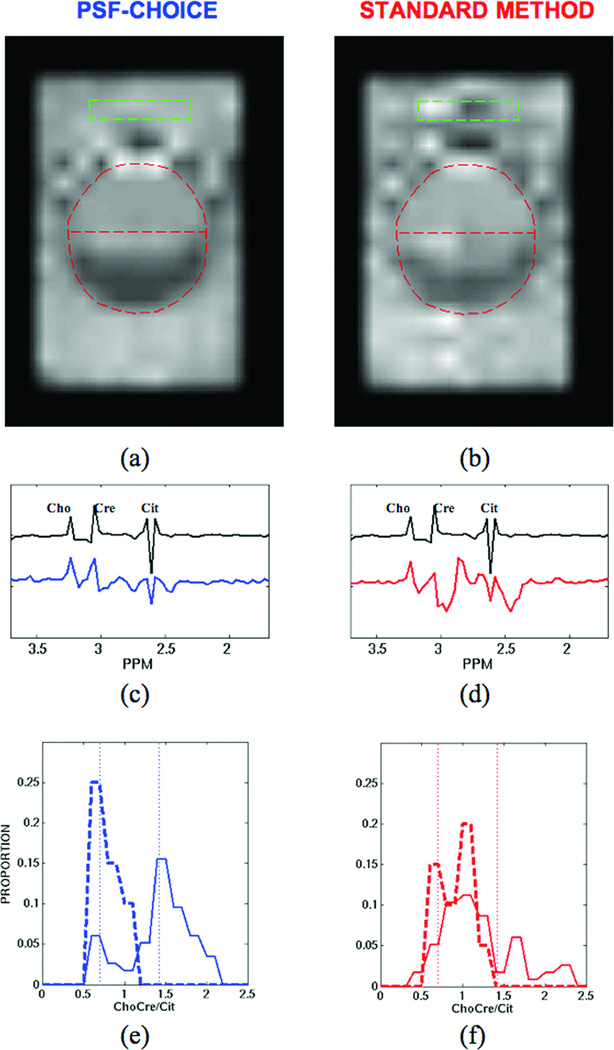
Figure 3.
Results from diagnostic-quality phantom for PSF-Choice and the Standard Method (Fourier phase encoding): Images showing ChoCre/Cit for (a) PSF-Choice and (b) the Standard Method. The ChoCre/Cit images were interpolated and registered to the reference image shown in Fig.1b. The position of the inner sphere is indicated by the red dashed line. Black plots in (c) and (d) show a reference spectrum obtained from the compartment simulating cancer (with ChoCre/Cit = 1.43). Below the reference plots are spectra from within the simulated cancer compartment (at location indicated by green box) for both PSF-Choice (blue plot in (c)) and for standard phase encoding (red plot in (d)). Plots for (e) PSF-Choice and (f) for standard phase encoding show the distribution of metabolite ratios for the two compartments (cancer = solid line, normal = dashed line). The true values of the ratio for each of the two compartments (0.7 and 1.43 ppm) are indicated by the vertical dotted lines.

