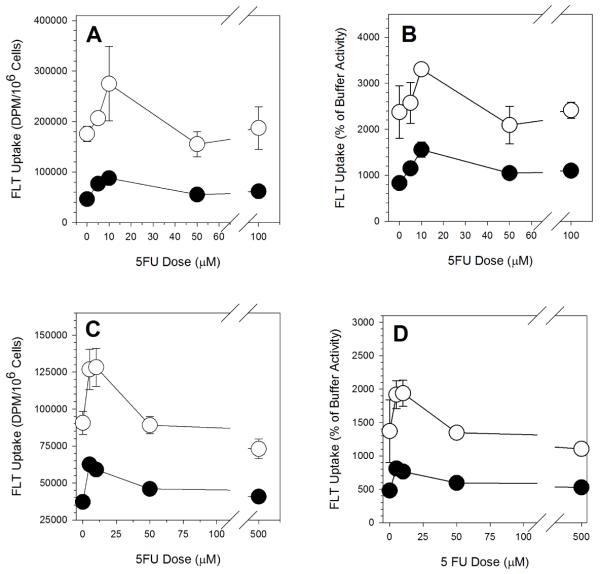
Figure 1.
5FU Dose-Dependent FLT Uptake in A549 Cells. (A) Intracellular levels of tracer (dpm/106 cells) in exponentially growing cells incubated in tracer-containing buffer. (B) Intracellular levels of tracer (dpm/106 cells) in plateau-phase cells incubated in tracer-containing buffer. (C) Intracellular levels of tracer (% of activity in cell-equivalent volume of buffer) in exponentially growing cells incubated in tracer-containing buffer. (D) Intracellular levels of tracer (% of activity in cell-equivalent volume of buffer) in plateau-phase cells incubated in tracer-containing buffer. Open symbols: incubation with FLT in buffer. Filled symbols: incubation with FLT in NBMPR-containing buffer. Results are the mean ± SD of at least three replicates.

