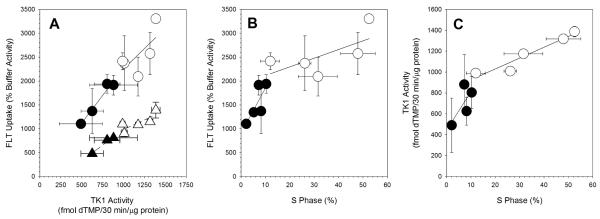
Figure 4.
Comparisons between endpoints. (A) FLT Uptake versus TK activity (○, exponentially growing cultures; •, plateau-phase cultures; Δ, exponentially growing cultures incubated in NBMPR-containing buffer; ▲ plateau-phase cultures incubated in NBMPR-containing buffer). (B) (A) FLT Uptake versus S phase percentage (○, exponentially growing cultures; •, plateau-phase cultures; Δ, exponentially growing cultures incubated in NBMPR-containing buffer; ▲ plateau-phase cultures incubated in NBMPR-containing buffer). (C) TK activity versus S phase percentage (○, exponentially growing cultures; •, plateau-phase cultures). Regression lines are shown.

