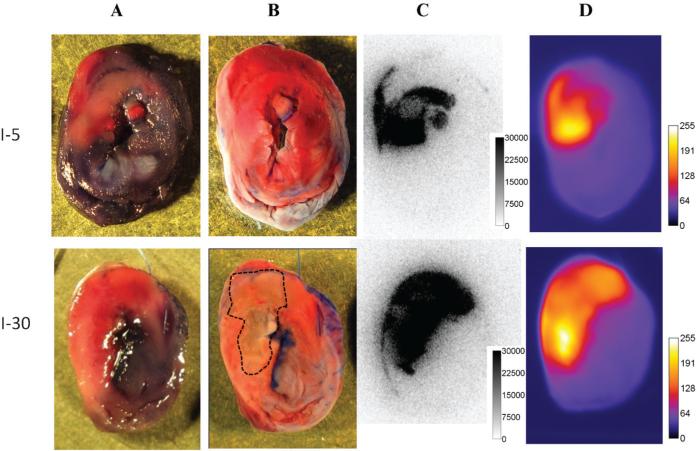
Figure 3.
A, Digital photographs of 2 mm slices of rat hearts subjected to 5 minutes ligation of the left coronary artery (LCA) (I-5) or 30 minutes ligation of the LCA (I-30) and sacrificed 90 minutes following 99mTc glucarate injection. The area at risk is unstained by Evans blue (pink areas in A). B, Infarcted areas are visible as TTC-negative (pale yellow-white) in I-30 and are marked by a dashed line. C, Corresponding autoradiograms with regions of high 99mTc glucarate uptake matching the area at risk and no uptake in normal myocardium. D, Fluorescence images of the same myocardial slices showing uptake of compound 1 in the area at risk with topography similar to that of 99mTc glucarate.

