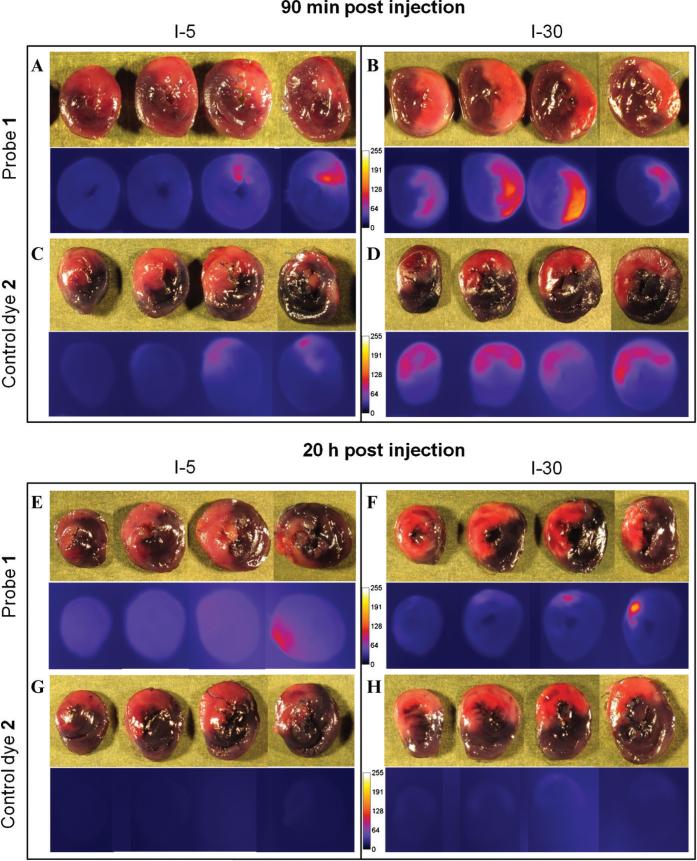
Figure 4.
Fluorescence images of targeting of ischemia-reperfusion injury by compound 1 (A, B, E, and F) or control dye 2 (C, D, G, and H) in hearts subjected to 5 minutes (left panels) or 30 minutes (right panels) ligation of the left coronary artery. Images were collected at 90 minutes (upper panels) or at 20 hours (lower panels) postinjection. The area at risk is devoid of Evans blue staining (pink areas in top rows). Fluorescence images were thresholded to the same absolute value.

