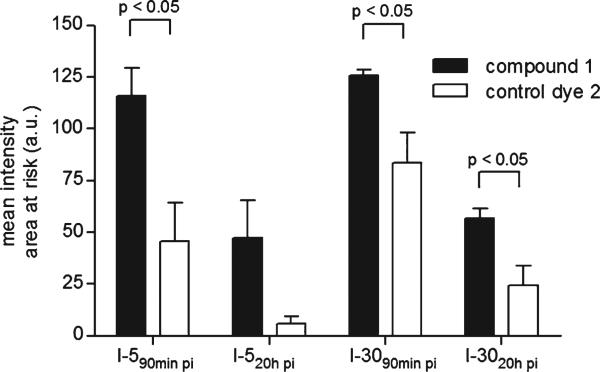
Figure 5.
Ex vivo mean fluorescence intensities in the area at risk of hearts subjected to 30 minutes (I-30) or 5 minutes (I-5) ligation of the left coronary artery at 90 minutes or 20 hours following intravenous injection of compound 1 or control dye 2. Values are presented as mean ± SD. Three rat hearts were used to calculate the mean intensity at each time point.

