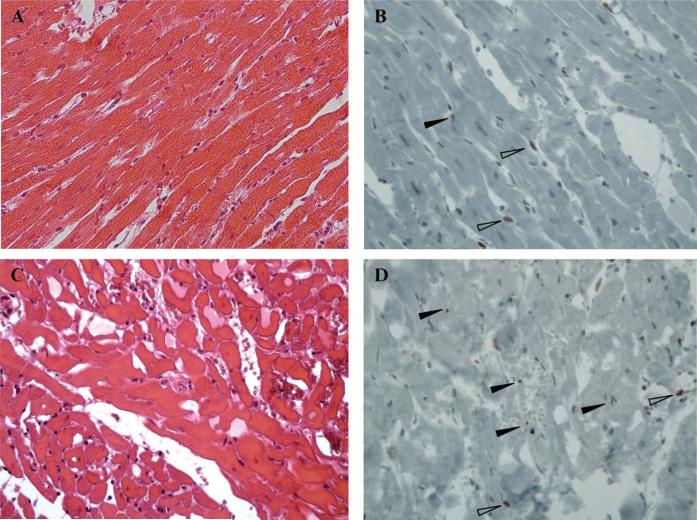
Figure 6.
Representative hematoxylin-eosin staining (A and C) and cleaved caspase-3 immunostaining (B and D) of 3 μm myocardial sections of rats subjected to 5 minutes (A and B) or 30 minutes (C and D) ligation of the left coronary artery (Magnification × 20). Filled arrows indicate apoptotic cells. Open arrows indicate positively stained cells with normal nuclear morphology.

