Figure 2.
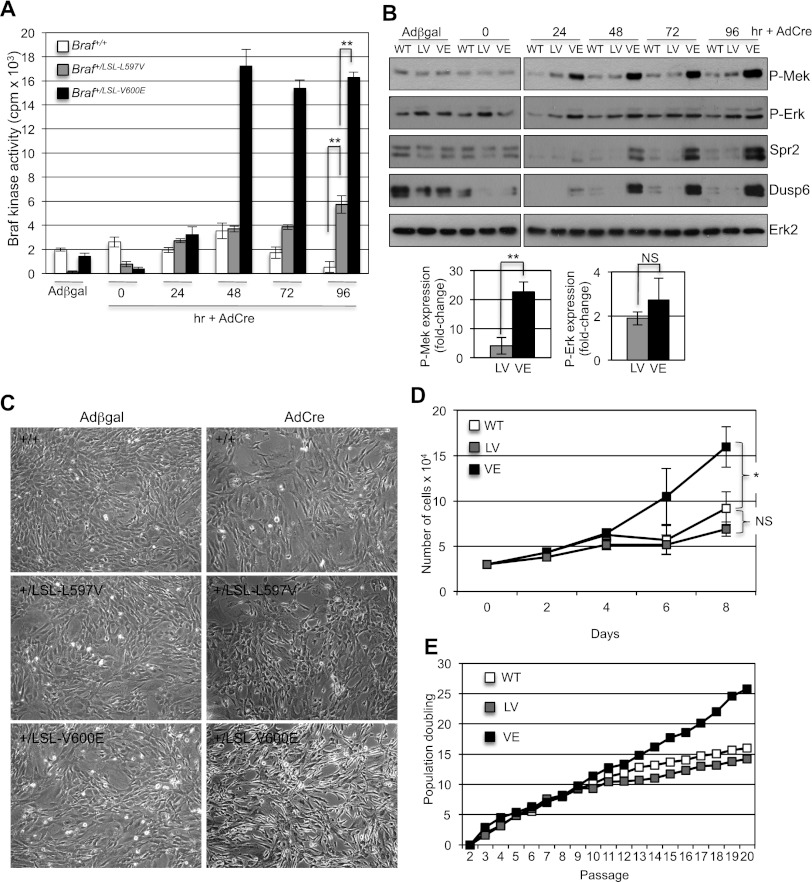
Characterization of MEFs expressing L597VBraf. (A) Braf kinase assays of soluble protein lysates taken from Braf+/+, Braf+/LSL-L597V, and Braf+/LSL-V600E MEFs treated with AdCre for 0–96 h or Adβgal for 96 h. Columns indicate the mean of three samples, and bars indicate the SD. (B) Western blot analysis of protein lysates from Braf+/+, Braf+/LSL-L597V, and Braf+/LSL-V600E MEFs treated with AdCre for 0–96 h or Adβgal for 96 h. Western blots were analyzed with the antibodies indicated. Quantification of Western blot analysis of Mek/Erk phosphorylation for the 96-h time point is shown in the graphs below. P-Mek and P-Erk levels were normalized to Erk2, the fold changes compared with AdCre-infected wild-type (WT) cells are shown, and error bars indicate the SEM. Data were pooled from three MEFs with the same genotype. (C) Representative photographs of Braf+/+, Braf+/LSL-L597V, and Braf+/LSL-V600E MEFs treated with AdCre or Adβgal for 96 h. (D) Growth curves of primary Braf+/+ (wild-type), Braf+/Lox-L597V (LV), and Braf+/Lox-V600E (VE) MEFs over 8 d immediately following 72 h of treatment with AdCre. Mean values of three technical replicates of MEFs of each genotype are shown, and error bars indicate the SEM. These are representative profiles of four different MEFs of each genotype. (E) 3T3 immortalization profiles of primary Braf+/+ (wild-type), Braf+/LSL-L597V (LV), and Braf+/LSL-V600E (VE) MEFs treated with AdCre. Representative profiles of three different MEF lines of each genotypes are shown. For all data, P-values were calculated using the Student's t-test; (*) P < 0.01; (**) P < 0.005; (NS) not significant.

