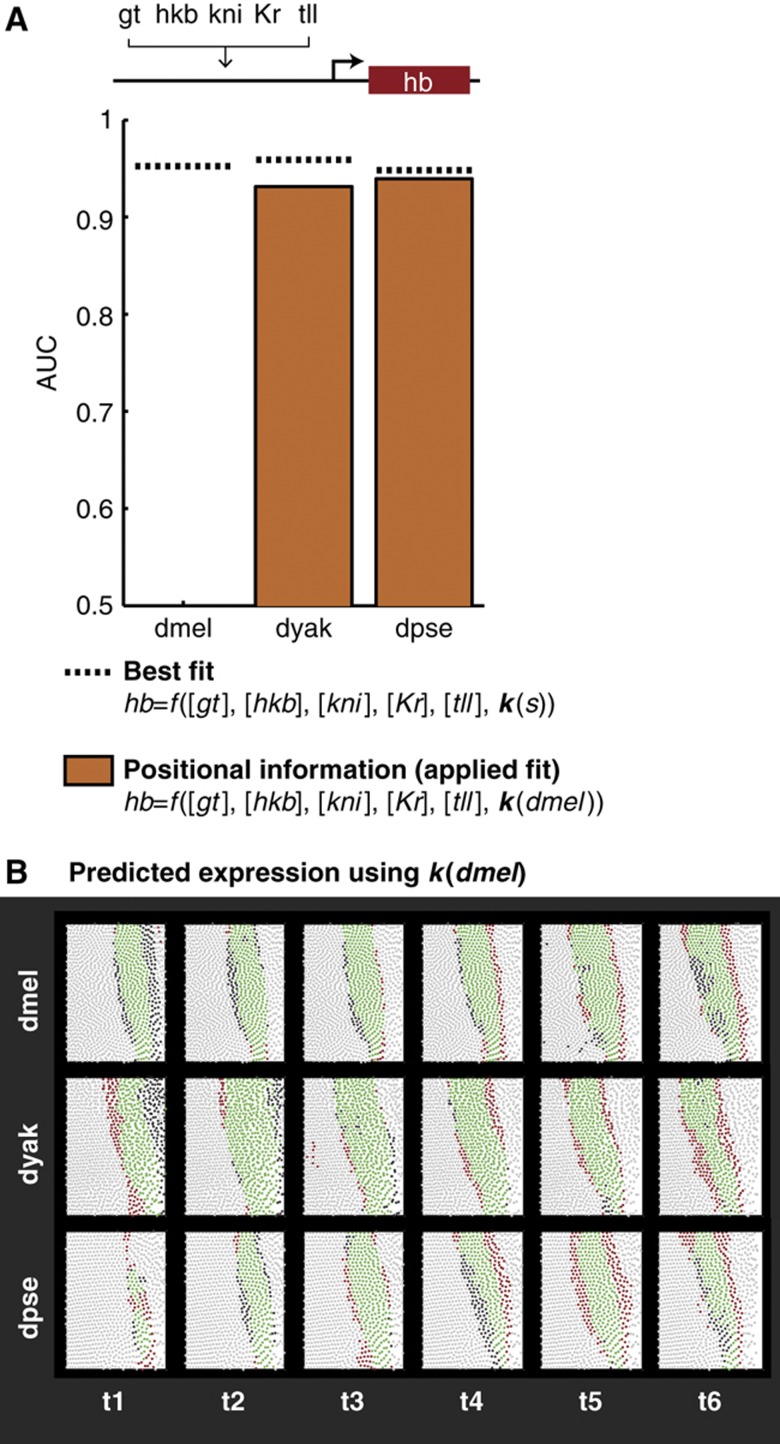
Figure 3.
A linear model fits endogenous hb expression patterns with high accuracy. (A) Changes in positional information account for a large portion of hb expression pattern divergence. Here, we show the results of fitting a multiple linear regression model to the endogenous hb pattern in each species (dotted line, best fit) and by fitting to dmel and applying the resulting coefficients to the hb patterns in dyak and dpse (orange bars, positional information). Performance of the model was measured using the area under the ROC curve (AUC), and the results are plotted for the species in order or increasing phylogenetic distance from dmel. (B) Differences in the hb expression pattern can be explained using a common parameter set. We show the detailed results of the positional information model, using k(dmel). For the sake of visualization, we found a threshold for each species that yielded an 80% true positive rate. This corresponds to a single point on the ROC curve that we integrated to calculate the AUC scores shown in (A). Each circle in the subpanels corresponds to a cell, with green and light gray circles corresponding to correct predictions in which the cell is on (green) or off (light gray) in the experimental data. The red and dark gray cells correspond to incorrect predictions, in which the cell is off (red) or on (dark gray) in the experimental data.

