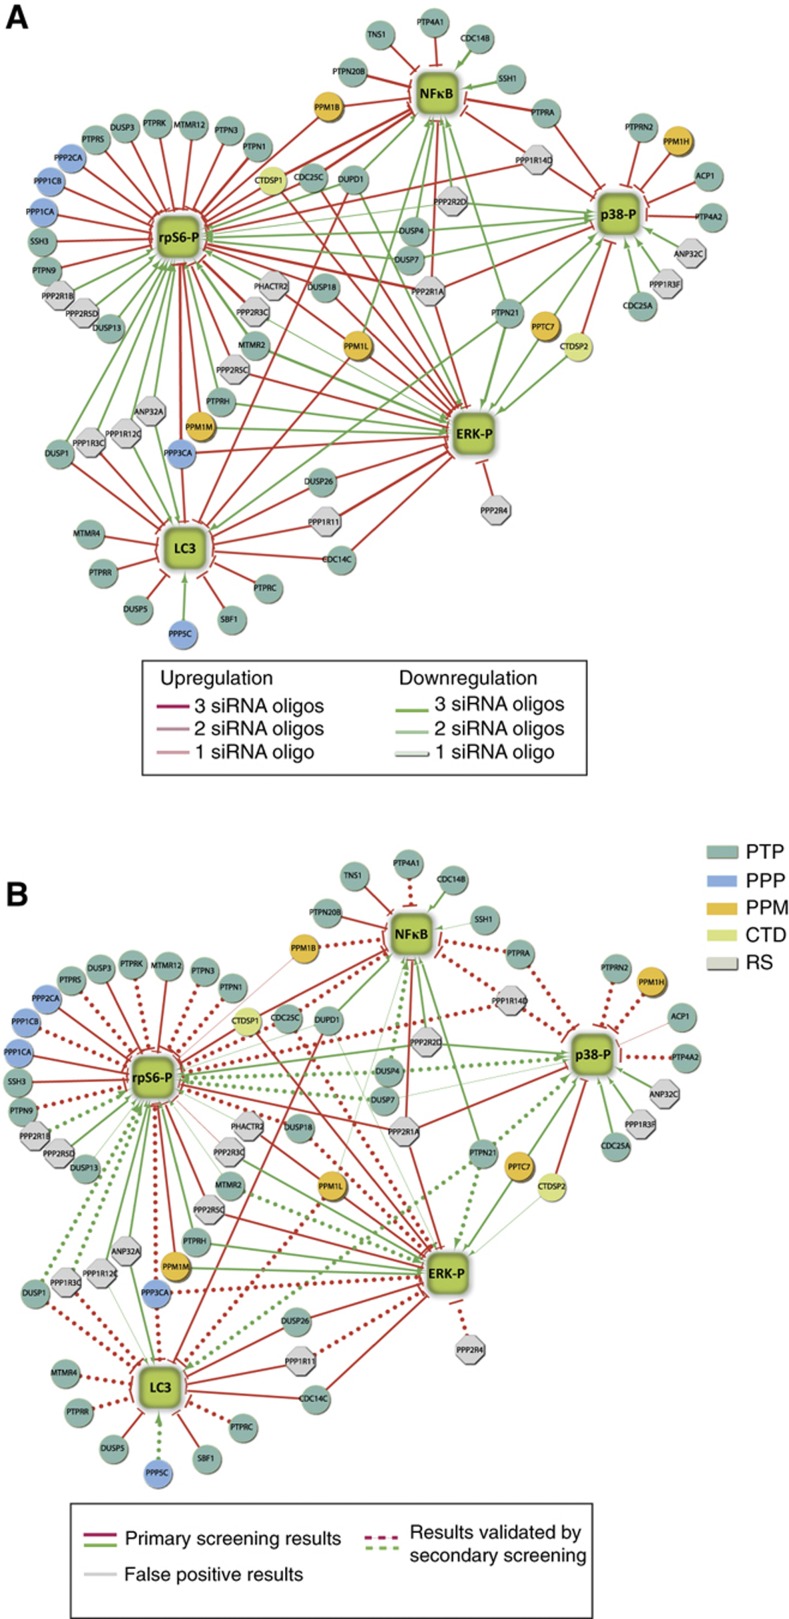
Figure 3.
Graphical representation of the siRNA screening results. (A) The results of the siRNA screening are illustrated as a graph. The green squares represent phenotypes. Phosphatases (circles) are colored according to their functional classification (Supplementary Table S1): PTP, Protein Tyrosine Phosphatases; PPP, Phosphoserine Proteine Phosphatases; PPM, Protein Phosphatase Metal dependent; CTD, Carboxy Terminal Domain phosphatases; RS, Regulatory Subunits. Edges represent a functional relationship, linking the phosphatase hits to the phenotypes that are affected by interference of phosphatase expression. Positive and negative regulators are linked to the readout by green and red edges, respectively. The three intensities of the edge colors reflect the number of different phosphatase-specific oligos that support the observation in the primary siRNA screening. (B) Illustration of the results of the secondary screening carried out with an independent shRNA library. Gray edges indicate functional relationships that were not confirmed in the secondary screening, whereas dashed edges indicate results validated by secondary screening. The experimental observations that were not retested in the secondary screening are showed as continuous edges.

