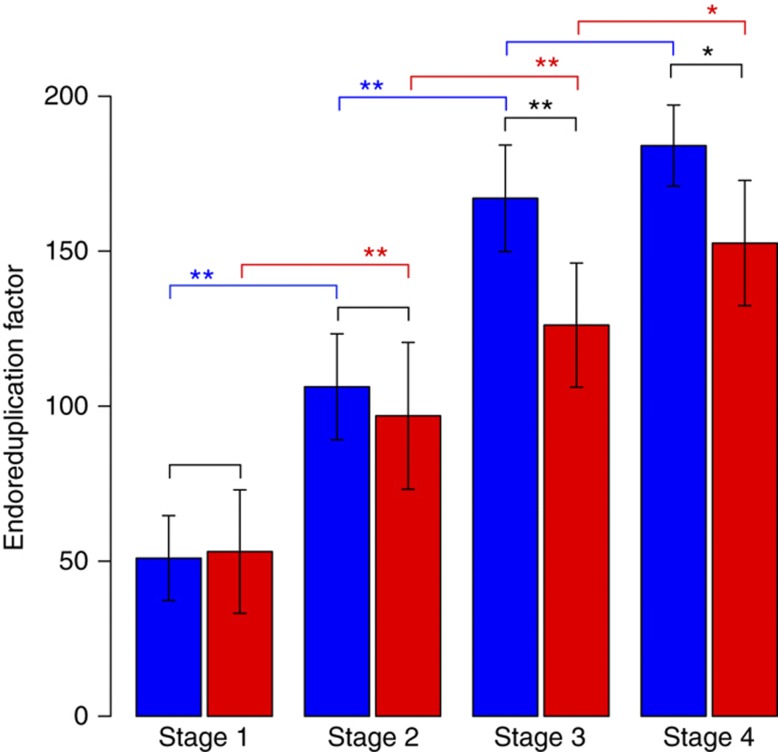
Figure 3.
Endoreduplication during leaf development. Endoreduplication factors were calculated and compared for the four development stages in SOW (blue) and SWD (red). Graphs show mean and s.d. values, n≥5; ** indicates statistical significance at level P<0.01, and * at level P<0.05 (two-sided Welch test). Source data is available for this figure in the Supplementary Information.

