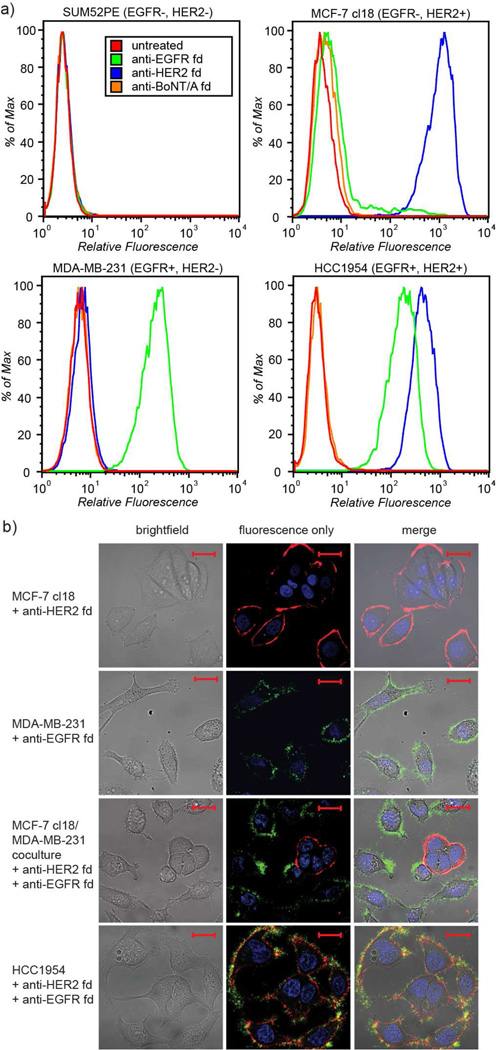
Figure 3.
Fluorophore modified fd phage cell binding results. a) Flow cytometry with AF488 labeled phage (applied at 0.8 nM) indicated selective recognition of EGFR and HER2 epitopes. The legend for all histograms is shown in SUM52PE inset. Gating data are shown in Supporting Information Figures S4–S7. b) Live cell confocal microscopy images of fluorescently labeled anti-HER2 and anti-EGFR fd showed marker-specific binding to breast cancer cell lines. Fluorescence is as follows: DAPI (blue), anti-HER2 fd (red), anti-EGFR fd (green). Scale bars represent 20 µm. Control and larger images with all fluorescence channels are shown in Supporting Information Figures S8–S12.

