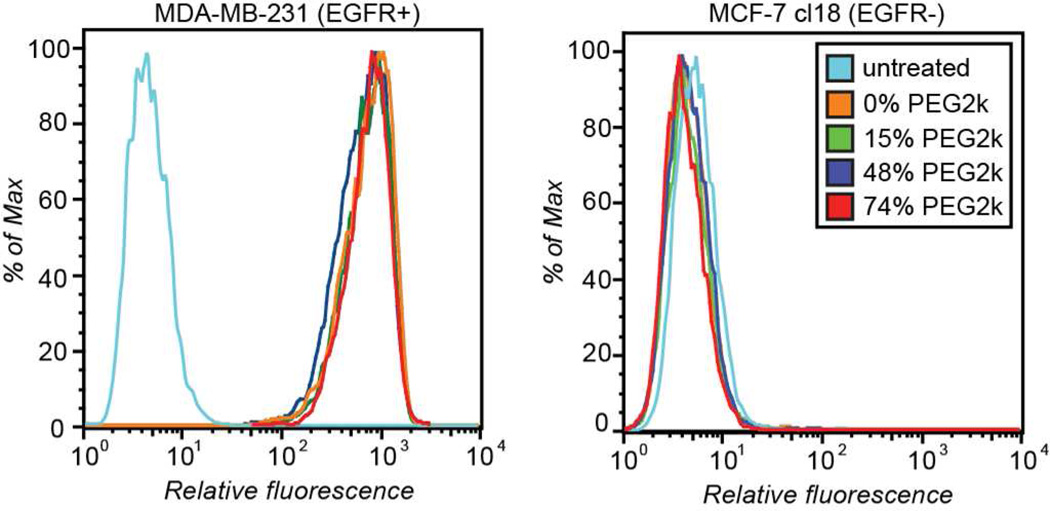
Figure 4.
Flow cytometry analysis of AF488 labeled anti-EGFR fd possessing various levels of PEG modifications. The target cells were MDA-MB-231 (EGFR+, left) and the control cells were MCF-7 cl18 (EGFR−, right). Phage concentrations were 0.8 nM. Gating data are shown in Supporting Information Figure S16. As a negative control, anti-BoNT fd labeled with nearly identical levels of PEG were incubated with both cell lines, and showed no binding (see Supporting Information Figures S17–S18).

