
Figure 2.
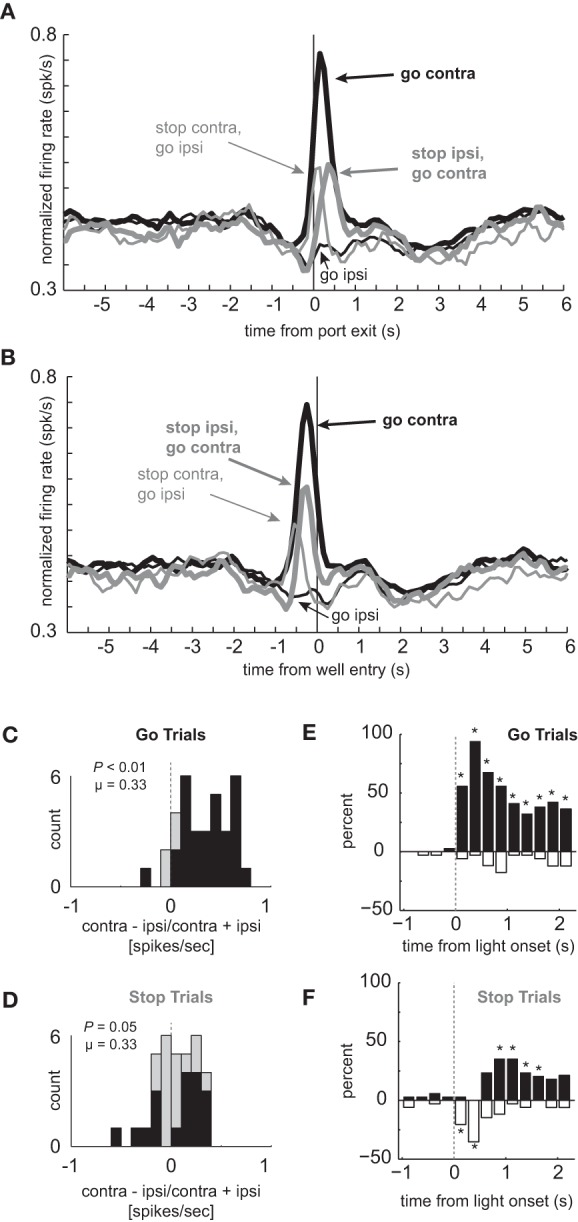
Response inhibition and reduced directional selectivity in mDS. (A,B) Population of neurons that showed significant elevation on GO vs. STOP trials for contralateral movements (n = 34). Direction is referenced to recording location. Thick and thin lines represent contralateral and ipsilateral direction, respectively. Black and gray represents GO and STOP trials, respectively. Activity is aligned to port exit (A) and fluid well entry (B), respectively. (C,D) Distribution of directional indices determined by subtracting activity taken from port exit to well entry (response epoch) for ipsilateral movement trials from contralateral movement trials and dividing by the sum of the two (contra – ipsi/contra + ipsi). Black bars represent the number of neurons that showed a significant difference between contralateral and ipsilateral trial types during the response epoch (t-test; p < 0.05). (C) and (D) reflect the distribution of direction indices for GO and STOP trials, respectively. Distributions are determined to be significantly different from zero via Wilcoxon. (E,F) Time course of significant effects for 250 ms epochs aligned to the onset of the first directional cue light. Height of positive and negative bars reflects the percentage of neurons that fired more strongly on trials for correct movements made in the contralateral and ipsilateral movement, respectively, for GO (E) and STOP (F) trials. Asterisks represent significant differences between counts of neurons (black vs. white bar; chi-square; p < 0.05).