
Figure 3.
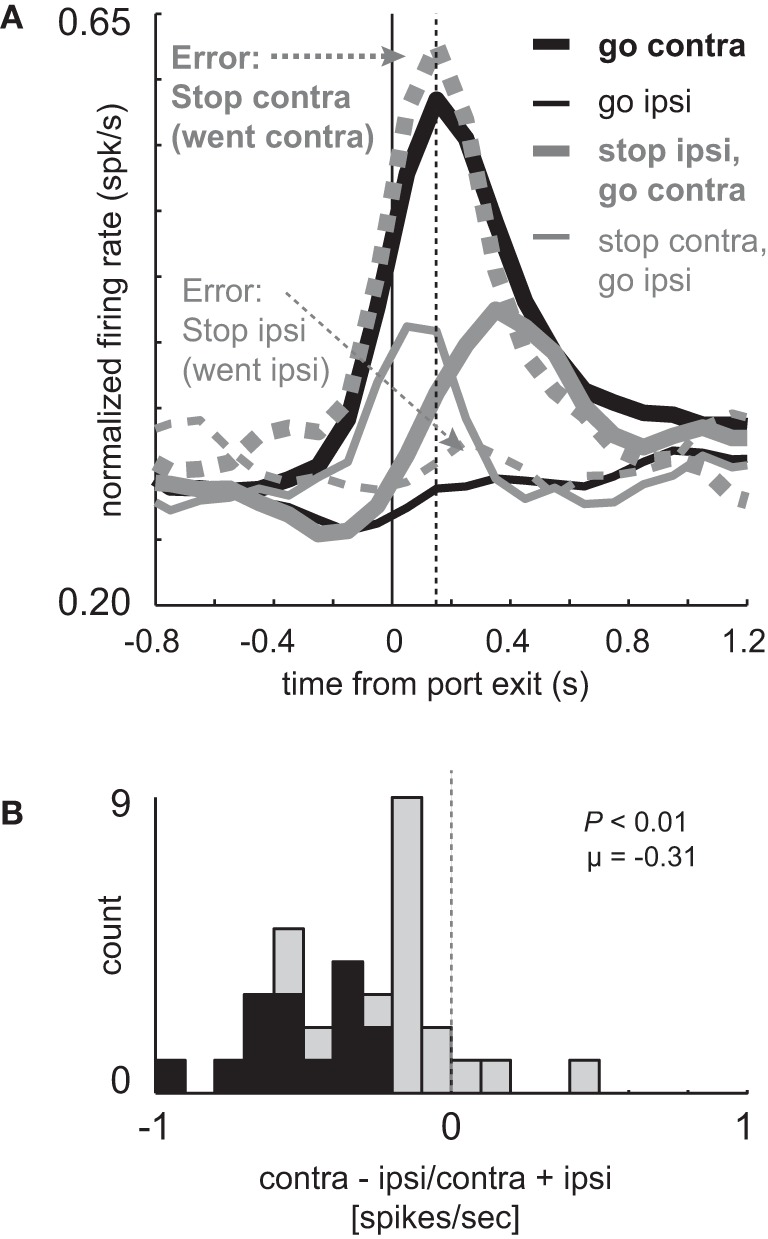
Miscoding of directional selectivity in mDS during STOP errors. (A) Curves representing normalized population firing rate (n = 33) for neurons that showed elevated firing on GO compared to STOP trials for movements made in the contralateral direction. Neurons were taken from sessions where at least one STOP trial occurred in each direction. Thick and thin lines represent contralateral and ipsilateral direction, respectively. Black and gray lines represent GO and STOP trials, respectively. Solid and dashed lines represent correct responses and errant responses on STOP trials, respectively. Thick dashed gray lines reflect a condition where the rats had to cancel the contralateral movement but failed (i.e., went contralateral). Thin gray dashed lines reflect a condition where the rats had to cancel the ipsilateral movement but failed (i.e., went ipsilateral). Vertical dashed line represents the time required to stop and redirect behavior (SCRT) as computed by taking the difference between correct STOP and GO trials during these sessions. (B) Distribution of directional indices for the firing of single neurons during STOP trial errors (contra – ipsi/contra + ipsi) where direction refers to the side in which the animal responded, not the side cued by the second cue light. This activity was analyzed during the response epoch (t-test; p < 0.05).