Fig. 1.
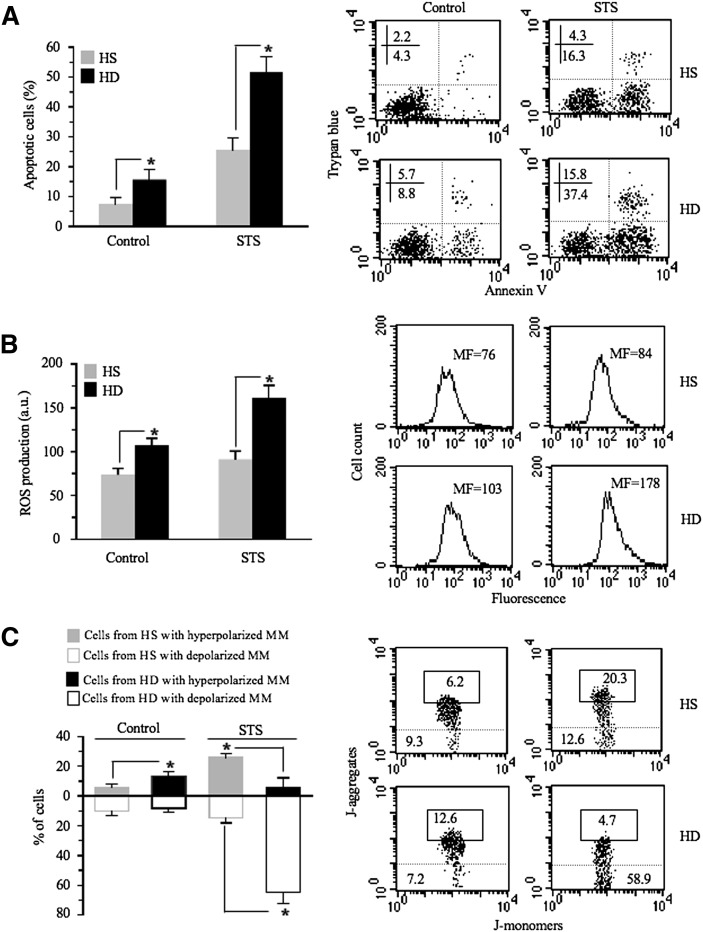
Analysis of apoptosis, ROS, and mitochondrial membrane potential. A: Biparametric flow cytometry analysis of apoptosis after double staining of cells with annexin V-FITC/Trypan blue. In the left panel, bar graph shows the results obtained from three independent experiments reported as mean ± SD. * P < 0.01. In the right panels, dot plots from a representative experiment are shown. Numbers represent the percentage of annexin V single-positive cells (early apoptosis, lower right quadrant) or annexin V/Trypan blue double-positive cells (late apoptosis, upper right quadrant). B: Cytofluorimetric analysis of superoxide anion production. Values reported represent the median fluorescence. In the left panel, bar graph reporting the mean of the results obtained from four independent experiments ± SD is shown. * P < 0.01. In the right panels, results obtained in a representative experiment are shown as fluorescence emission histograms. C: Biparametric flow cytometry analysis of MMP after staining with JC-1. In the left panel, bar graph shows the results obtained from three independent experiments reported as mean ± SD. Full (gray or black) and empty columns represent the percentages of cells with hyperpolarized or depolarized mitochondrial membranes, respectively. * P < 0.01. To note that independently of any treatment, a MMH was detectable in a significantly higher percentage of cells from HD patients in comparison to cells from HS (black and gray bars, respectively). After treatment with STS, according to apoptosis data (see Fig. 1A), the percentage of cells with MMD was significantly higher in cells from HD patients than in cells from HS (empty columns). In the right panels, dot plots from a representative experiment are shown. Numbers reported in the boxed area represent the percentages of cells with hyperpolarized mitochondria. In the area under the dotted line, the percentage of cells with depolarized mitochondria is reported.

