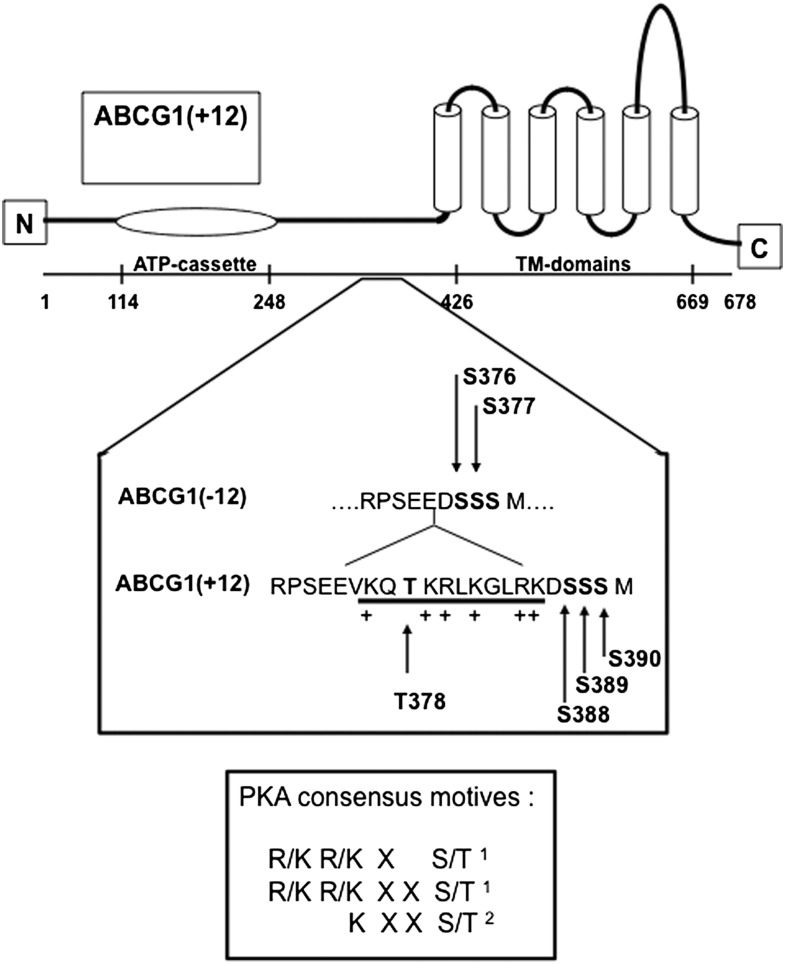
Fig. 1.
Diagram of ABCG1 protein with detailed sequence of ABCG1(− 12) and ABCG1(+12) around the 12 AA section. Arrows indicate threonine and serine residues identified as potential phosphorylation sites in ABCG1(+12) and the equivalent sites in ABCG1(− 12). PKA consensus sites are indicated in the box (1 and 2 refer to references 14 and 13, respectively).

