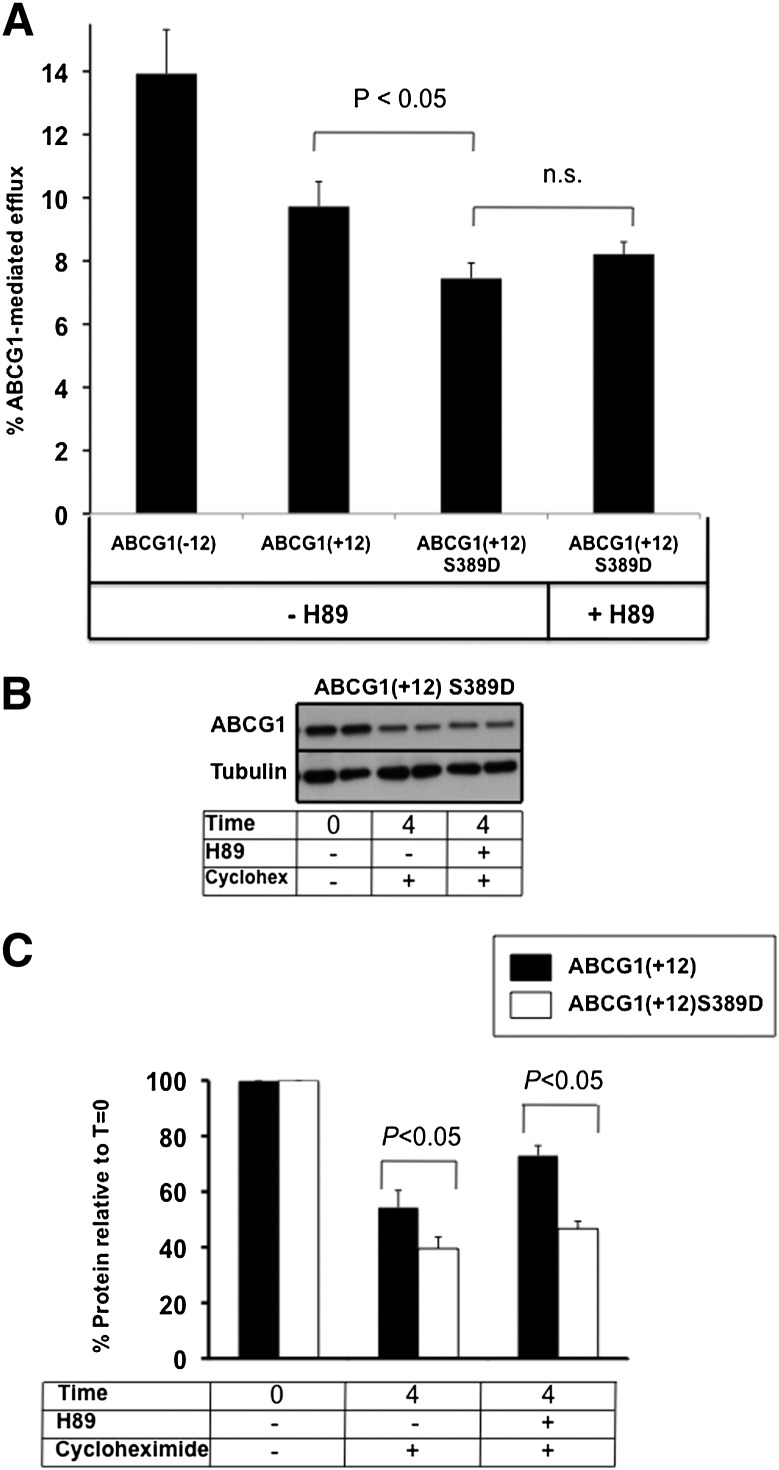
Fig. 5.
Effect of H89 on ABCG1(+12)-S389D cholesterol export and protein levels. A: Cholesterol export was measured as described in the legend to Fig. 2 and Materials and Methods from ABCG1(+12)-S389D-overexpressing cells and compared with the parental ABCG1(+12) cell line, with and without the addition of H89 (10 μ M). B: ABCG1(+12)-S389D-overexpressing cells were incubated with or without H89 in the presence of cycloheximide (10 μg/ml), as described in the legend to Fig. 4. Data are representative of at least three independent experiments. C: Bands were quantified using Image J software, and results were expressed relative to the starting levels at T = 0 for each experiment. Results are mean ± SEM of duplicate cultures from three independent experiments, all performed in duplicate cultures. Data for ABCG1(+12) wild-type are same as those presented in Fig. 4C.

