Fig. 4.
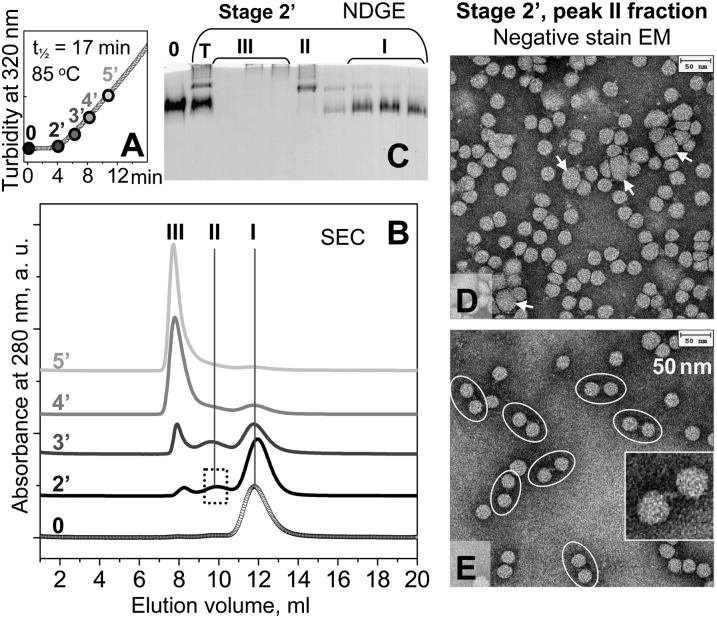
Morphological analysis of LDL at early stages of heat denaturation. (A) LDL sample under standard conditions was subjected to a T-jump from 4°C to 85°C, and LDL fusion was monitored by turbidity at 320 nm. Aliquots were taken at different incubation times at 85°C, from 2′ (200 sec) to 5′ (500 sec) prior to the denaturation midpoint (t1/2=17 min for this sample); 0 stands for intact LDL. (B) SEC of selected aliquots (0, 2′, 3′, 4′, 5′) that were eluted with 20 mM Na phosphate, pH 7.5. Three major peaks in the SEC profile are marked I, II, and III. The results agree with the earlier SEC studies of LDL showing increased particle size upon heat denaturation (43). (C) NDGE of LDL sample at denaturation stage 2′. SEC fractions encompassing peaks I, II, and III are numbered. T, total plasma LDL; 0, intact LDL. (D, E) Negative-stain electron micrographs of peak II isolated by SEC from LDL at stage 2′. The sample was diluted to protein concentration of 100 μg/ml (D) or 20 μg/ml (E) prior to deposition on the grid. Arrows show enlarged (fused) particles, and ovals show intact-sized LDL tethered in pairs. Insert shows a zoomed-in pair of LDL particles and their connecting strand (E).

