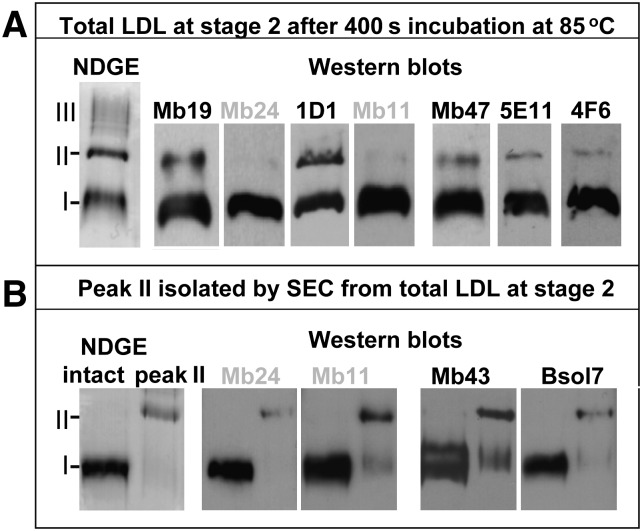
Fig. 5.
Immunochemical analysis of LDL at an early stage of thermal denaturation. (A) LDL solution under standard conditions was incubated for 400 sec at 85°C as described in Fig. 4 and analyzed by NDGE followed by immunoblotting using mAbs that bind to epitopes from the N- or the C-terminal thirds of apoB. Three major bands corresponding to SEC peaks I, II, and III in Fig. 4 are indicated on NDGE (left). Western blots show mAbs binding to bands I and II. (B) Peak II fraction isolated by SEC was subjected to NDGE and immunoblotting using selected mAbs. The results for peak I are shown for comparison. The epitopes for mAbs used in this work are shown in supplementary Table I and supplementary Fig. III.

