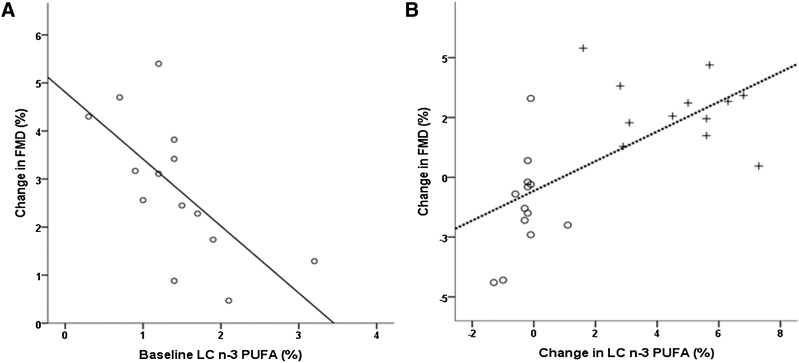
Fig. 2.
(A) Correlation between absolute change in FMD response from overnight fasting value (time = 0) to the postprandial measurement (time = 240 min) following consumption of SFA+LC n-3 PUFA drinks and baseline NEFA LC n-3 in Asp298 females (ρ = −0.668, P = 0.009). (B) Absolute change in FMD response from overnight fasting value (time = 0) to the postprandial measurement (time = 240 min) and change in NEFA LC n-3 in Asp298 females following consumption of SFA (open circles) and SFA+LC n-3 PUFA (plus signs) drinks. (ρ = 0.664, P < 0.001)

