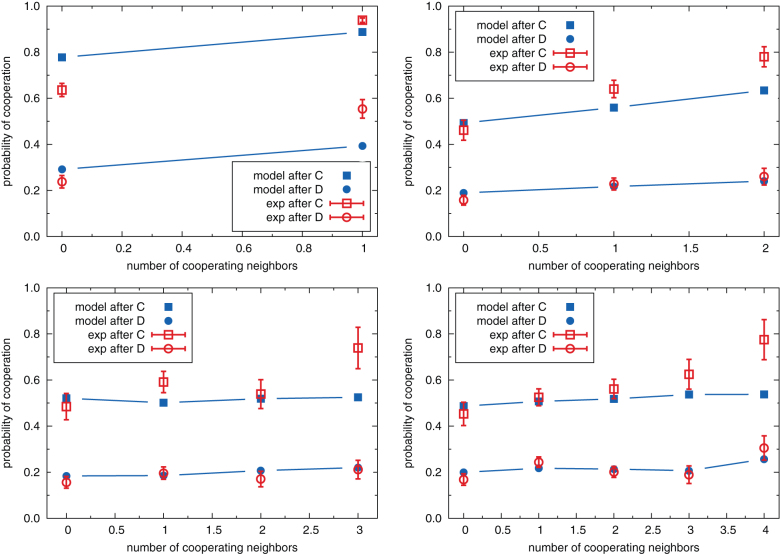
Figure 1. Probability that an individual cooperates after having cooperated (squares) and after having defected (circles) in the previous round, for groups of 2 (top left), 3 (top right), 4 (bottom left) and 5 (bottom right) people.
Open symbols, experimental results; full symbols, predictions from our GLMM. Error bars correspond to the standard deviation of the observations. Lines are only a guide to the eye.

