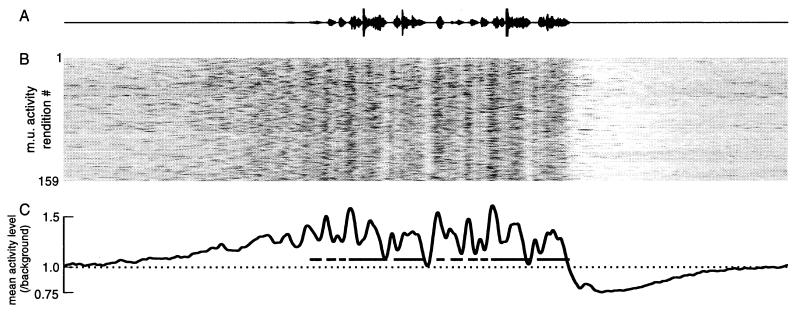
Figure 5.
LMAN neurons exhibit strong, singing-related activity. The oscillogram shows the song produced by the bird; the mean level of LMAN multiunit activity recorded in this bird before, during, and after each of 159 renditions of the song is shown below, aligned to the song. Activity level is represented by a color scale, where black indicates high neural activity, and white low activity (see ref. 36). The bottom trace shows the mean of activity during all of the renditions above, illustrating the onset of AFP activity before sound, and the peaks of activity related to syllables, which are indicated by the black bars. The duration of the entire panel is 4.5 sec.

