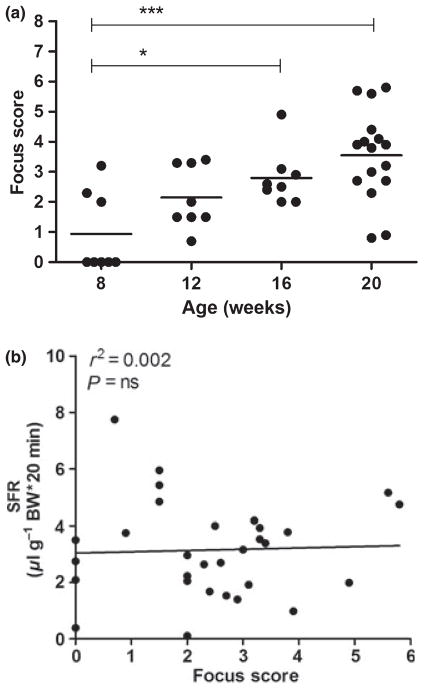
Figure 2.
Inflammation in salivary glands (SGs) from NOD mice. SGs were obtained from non-obese diabetic (NOD) mice at 8, 12, 16 (each n = 8) and 20 (n = 16) weeks of age, and focus score (FS) was determined in paraffin-embedded tissue sections by two independent examiners. Dot plots with distribution and mean values for individual animals, the group mean for each time point and significant P-values are shown (a). Correlation between individual mean FS and pilocarpine- stimulated salivary flow rate (SFR) of mice from all ages (n = 8; b)

