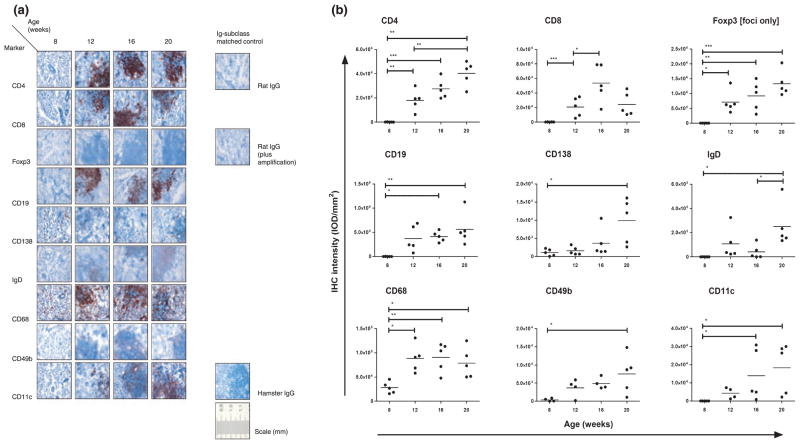
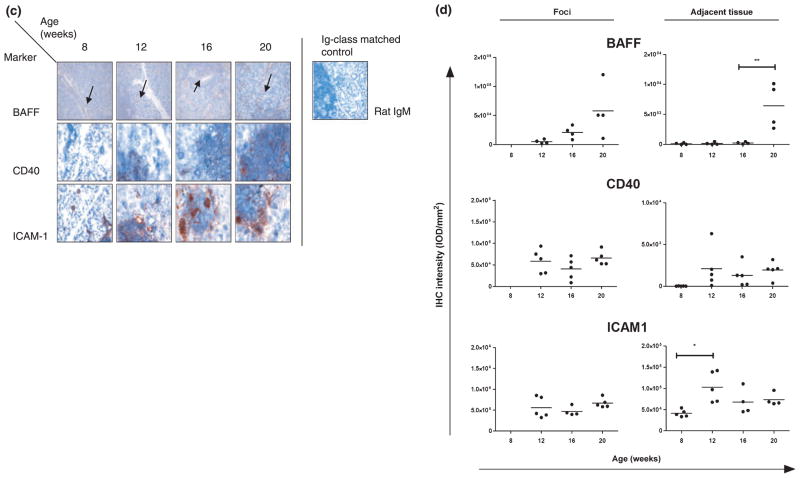
Figure 3.
Immunohistochemical staining of salivary glands (SGs) from NOD mice. Frozen and paraffin-embedded sections of SGs obtained from non-obese diabetic (NOD) mice at age 8, 12, 16 and 20 weeks (n = 5) were used. Immunohistochemical staining with antibodies against cellular markers (a) or immunomodulatory molecules (c), including immunoglobulin class- and species-matched control antibodies (negative control), are shown (scale bar in mm). Images of in total 18 high-power fields were assessed for foci and adjacent tissue, except for Foxp3, using digital image analysis. For cellular markers, dot plots with distribution for individual mice, mean staining intensity per area [expressed as internal optical density (IOD) mm−2] of foci and adjacent tissue together (foci only for Foxp3) and significant P-values are shown (b); for BAFF, CD40 and ICAM1, foci and adjacent tissue were digitally separated, analysed and displayed in separate graphs. Significant P-values are shown. (d). For reference, arrows indicate ductal epithelium in tissue stained for BAFF. IHC – immunohistochemical; BAFF – B cell-activating factor belonging to the tumour necrosis factor (TNF) family; ICAM1 – intercellular adhesion molecule 1


