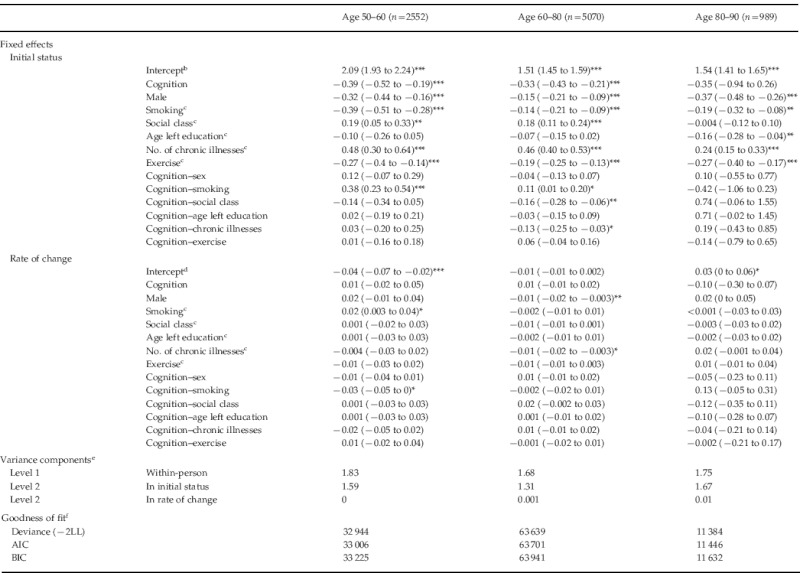
Table 3.
Results from piecewise linear mixed-effects models of depressive symptoms in three age groupsa

LL, Log-likelihood; AIC, Akaike's Information Criterion; BIC, Bayesian Information Criterion.
Data are given as regression coefficient (95% confidence interval).
Note: the covariance component is fixed at 0.
The intercept of the ‘initial status’ is the predicted average depressive symptom score at time 0, with all other covariates held at 0. In each age group, time is centered on the age at the start of that group. Therefore these intercepts represent the model-predicted average depression score at the ages of 50, 60 and 80 years, respectively.
For each of these ordinal covariates, the coefficients represent the difference in depressive symptom score for a one-category increase in the covariates as shown in Table 1 (i.e. non-smoker, lower social class, older age at leaving education, more chronic illnesses, more exercise).
The intercept of the rate of change is the average slope of depressive symptoms-on-time with all covariates held at zero. In each age group, time is centred on the age at the start of that group. Therefore these intercepts represent the model-predicted average slope of depressive symptoms-on-time at the ages of 50, 60 and 80 years, respectively.
The within-person variance is the overall residual variance, here the variance in depressive symptoms that is not explained by the model. The level-2 variance components are between-person variances. The initial status component is the variance of individuals' intercepts about the intercept of the average person. Likewise, the rate of change component is the variance of individual slopes about the slope of the average person.
Deviance is the difference in log-likelihood between the fitted model and the ideal saturated model. The AIC and BIC are essentially versions of the deviance penalized for the number of terms in the model. These are not all on an absolute scale, but the lower the number the better the fit.
p<0.05, ** p<0.01, *** p<0.001.
