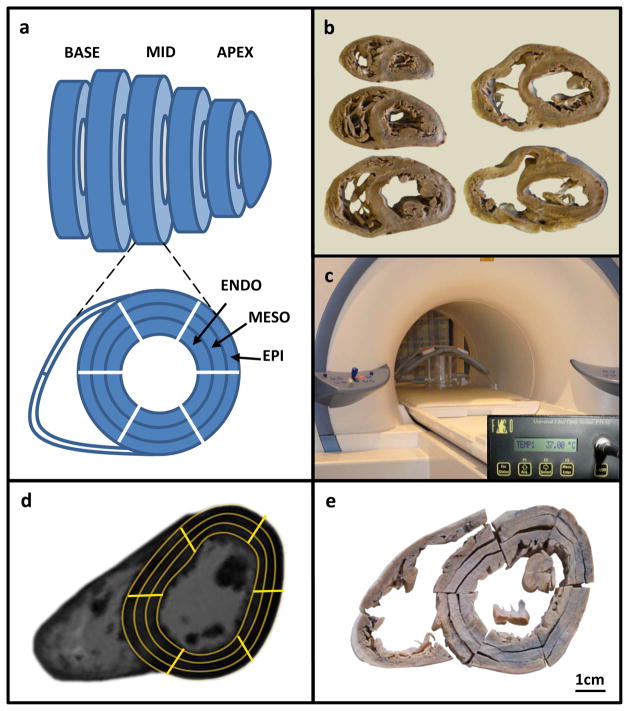
Figure 1.
Experimental setup.
A) Diagram of short-axis cardiac slices showing regions of interest (ROIs); B) Set of slices from a single heart; C) Slices inside scanner; D) Ex-vivo CMR image with ROIs used to determine T2* decay; E) Identical slice with segmentation performed to correspond with ROIs used for T2* measurement.

