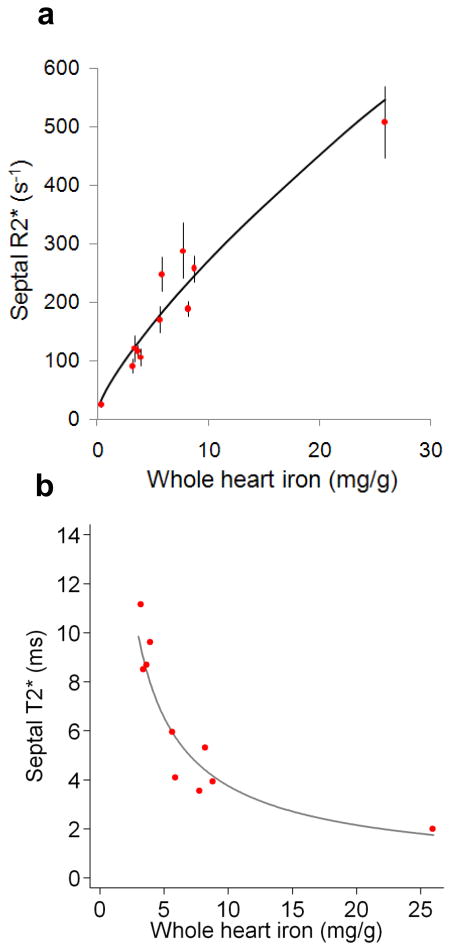
Figure 6.
Septal CMR measurements versus myocardial iron concentration.
A) Mean septal R2* plotted against mean iron concentration for each heart. Error bars are ±SD for septal R2* and the regression line is shown based on the log-log data shown in figure 5E. B) Mean septal T2* plotted against mean iron concentration for each heart. These two graphs illustrate the difference between T2* and R2* when compared to tissue iron. T2* shortens with increased iron concentration and hence its reciprocal R2* rises with tissue iron. T2* is used for clinical assessment of cardiac iron for historical reasons.

