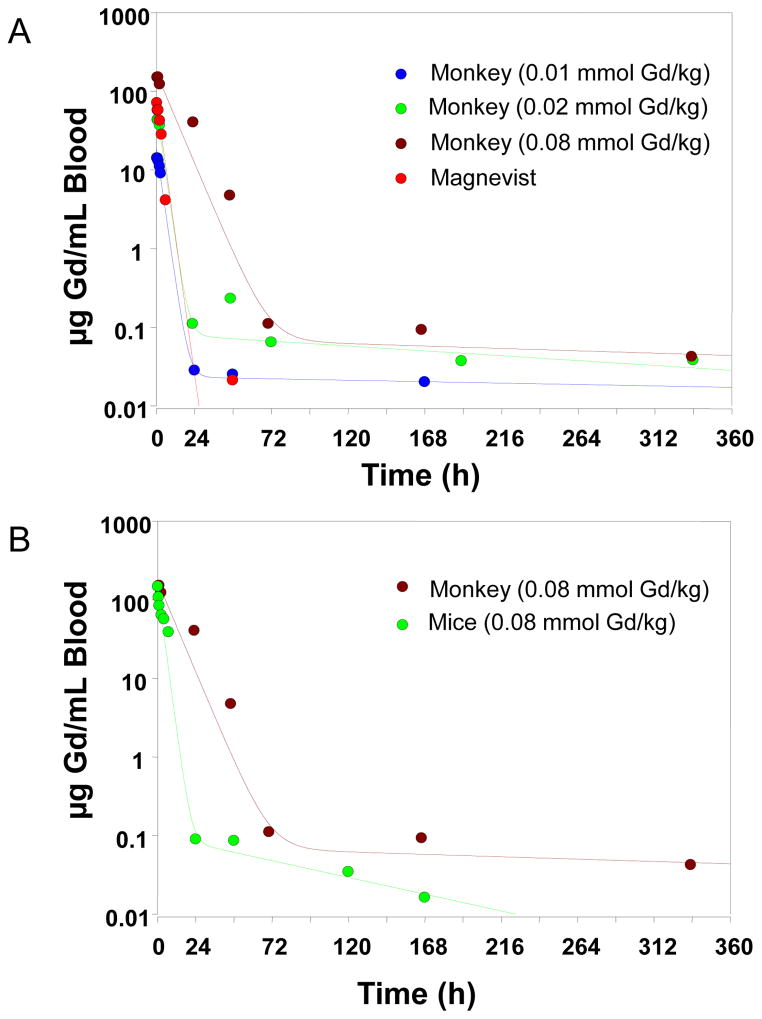
FIGURE 3.
Pharmacokinetic profiles of Gd in a monkey and mice. (A) Mean blood concentration versus time profiles for Gd after intravenous administration of PG-Gd at doses of 0.01, 0.02, and 0.08 mmol/kg and of Magnevist at a dose of 0.1 mmol/kg to monkeys. (B) Mean blood concentration versus time profiles for Gd after intravenous administration of PG-Gd at a dose of 0.08 mmol/kg to a monkey or mice. The lines represent the predicted blood concentration of PG-Gd.

