
Figure 7.
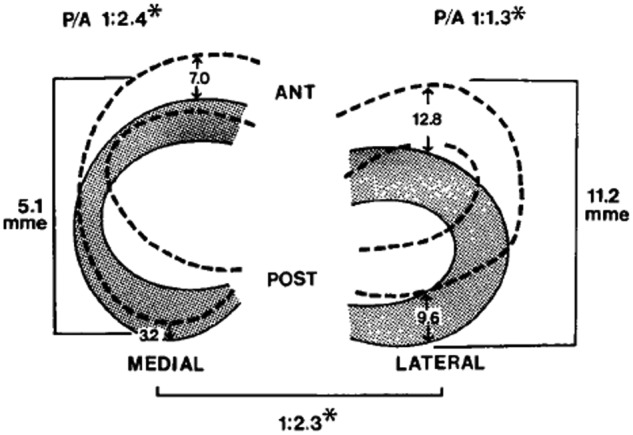
Diagrams showing the mean movement (mm) in each meniscus during flexion (shaded) and extension (hashed). ANT, anterior; POST, posterior; mme, mean meniscal excursion; P/A, ratio of posterior to anterior meniscal translation during flexion. Reproduced with permission from Thomspon et al.165
*P < 0.05 (Student t test analysis).