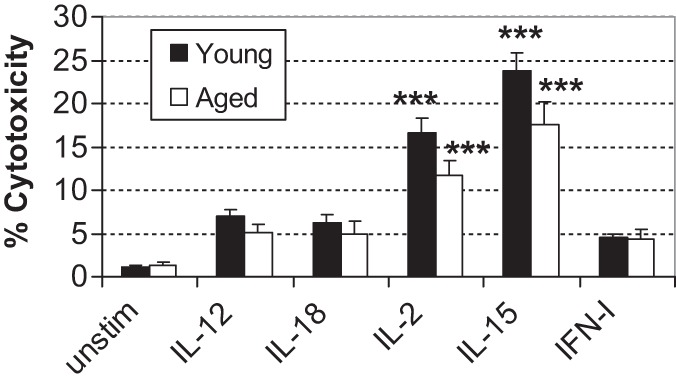
Figure 2.

NK cell cytotoxicity following cytokine stimulation. Splenocytes were cultured with cytokine for 24 hours. Following stimulation, NK cytotoxicity was assessed at E:T ratio at 50:1. Bars represent mean ± S E M. Asterisks on top of the bar indicate significant increase from the baseline within the age group. ***p < .001 analyzed by analysis of variance with Tukey–Kramer multiple comparisons. Total n = 12 per age group in each treatment, with results from three separate experiments combined.
